PLEXOS 7 New GUI Features
Contents
- Report Engine
- Map and Graph Visualization
- Overview Window
- Dashboard
- List Class
- Template/Inheritors Collection
- Timeslice Editor
- Create Change Database
- LP File Viewer
- New Quick Starts
- New Query History
- Hydro View
- SLD View
- Custom Columns
- Fill Command Enhancement
- Log File Viewer
- Action and Expression
- New Ribbon Function of Configuration Window
- Record Action
- Ribbon Context Menu
- Scenario Read Order
- Report Data Size Estimation
- Paste all Query Results to Excel
- Category Bulk Editing
- Export Database Comparison Result to Excel
- Execute to CSV
- Periods Total/List Total
- New Ribbon Menu of Chart Tab
- Auto Save
- Proxy Setting
- New Data File Viewer
- Change System
- Solution Statistics
- Convergence Chart
1. Report Engine
With more advanced projection and filtering than the Solution Viewer, the Report Engine feature is designed to give the User a wider range of controls for viewing results. Results can be generated in HTML or XML format. The Solution Reports Window is accessed via the File tab.
 Figure 1: Report Engine menu in file tab
The User has to load a solution database to enable controls of the window.
 Figure 2: The initial Reporting Window.
There are six (6) basic controls for filtering solution data, namely: Phase selection, Period Type selection, Series Type, Object Range, Date Range and Properties list. In addition, extra controls are available when there are more than one model/timeslice/sample in the solution database, viz: Model List, Timeslice List and Sample List, which are available .
The Query String allows the User to specify their own projection, additional filtering, and grouping by using select clause expressions, select clause functions, where clause, group by clause and order by clause.
Subreport can be created via the subreport links, which specify fields to link one report selection to the next.
| Child Name | Property | Datetime | Value |
|---|---|---|---|
| Gen1 | Generation | 1/1/2013 | 2.0 |
| Gen1 | Generation | 1/1/2013 12:00 | 2.0 |
| Child Name | Property | Datetime | Value |
|---|---|---|---|
| Gen1 | Generation | 1/1/2013 | 100.0 |
| Child Name | Property | Datetime | Value |
|---|---|---|---|
| Gen2 | Generation | 1/1/2013 | 1.0 |
| Gen2 | Generation | 1/1/2013 12:00 | 1.0 |
| Child Name | Property | Datetime | Value |
|---|---|---|---|
| Gen2 | Generation | 1/1/2013 | 100.0 |
Users can also save and load the report configuration in the left upper list. The left lower list allows the User to group stored configurations from the top most list into "batches", allowing multiple reports to be executed in one action.
For further details on how to report engine functions in PLEXOS GUI, please refer to Report Engine.
2. Map and Graph Visualization
Map Visualization window is accessed using the Map button from the Map tab of ribbon-style menu.
When connecting to map view for the first time, a Bing Map registration form will appear. The User would then have to register with their client area details. The window records the User and license information and keeps it for only 1 year. Users will have to re-register after license information expires. This ensures that we have up-to-date records.
 Figure: Bing registration form
 Figure 3: Map visualization
For further details on how to use the Bing Map visualization functions in PLEXOS GUI, please refer to Map Visualization.
Graph layout uses graph style visualization functions of PLEXOS GUI for input databases. Graph window is accessed using the Graph button from the Graph tab of the ribbon-style menu.
 Figure 4: Graph visualization
For details on how to use graph style visualization functions in PLEXOS GUI. Please refer to Graph Layout.
3. Overview Window
The Overview Window presents the Property Tab information for a given model, at a specified time. For the specified model and time given, the Overview Window will resolve the Templates, Scenarios, Date Ranges and Timeslices for each data row in order to present the value which will be used at that given time during the Horizon. CSV files which were used for the data file object can be viewed by clicking the file link directly.
 Figure 5: Overview Window
4. Dashboard
Dashboard works as a standalone application separated from PLEXOS desktop, but is installed as one single package.
 Figure 6: Dashboard Application
Note: The licence file is not inspected at start-up. However, if the license is missing, invalid, or has expired execution will not start. For help with licensing, contact the PLEXOS support desk at support@energyexemplar.com
It provides a dashboard style interface with the simulation workflow as its primary layout. Objects in the dashboard could represent objects or data which Users regularly edit or solution values that Users regularly access.
By using the command button functions, the User can open an input database or a dashboard project (*.pdpf), save layouts of dashboard as a project(*.pdpf), execute database and link to connect server.
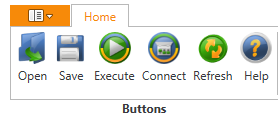 Figure 7: Dashboard buttons
There are 3 kinds of widgets, namely: input widgets, output widgets and control widgets.
Input widgets - Input and CSV widgets. They can modify input data and synchronize them with PLEXOS desktop. Input widgets can only have one instance.
 Figure 8: Dashboard Input Buttons
 Figure 9: Dashboard Input Widget
 Figure 10: Dashboard CSV Widget
Output widgets - Chart, Table and Report widgets. They can show solution data by chart/table/html. Chart and Table widgets can have multiple instances. Report widgets can only have one instance.
 Figure 11: Dashboard Output Widgets
 Figure 12: Dashboard Charts Widget
 Figure 13: Dashboard Tables Widget
 Figure 14: Dashboard Reports Widget
Control widgets - Greek and Log widgets. They control the way Dashboard executes, models, and reports results.
 Figure 15: Dashboard Control Widgets
 Figure 16: Dashboard Greek Widget
 Figure 17: Dashboard Log Widget
Please refer to dashboard for details on how to used Dashboard.
5. List Class
List is a new class introduced in PLEXOS 7. A List is a generic collections of objects. We can use List object as a filter to make some objects faint in object tree.
 Figure 18: List Class
Lists are also used to limit the objects that are reported during Model execution by adding the objects as children in a Report [Lists] membership. This function replaces the Report [*] collection, where '*' can be Generators, Fuels and etc.
 Figure 19: Report [List] Collection
Please refer to List Class for details on List class and properties reference.
6. Template/Inheritors Collection
A Template is an instance of an object (of any class) from which other objects of the same class derive their data. The parent object (or high level object) inherits the property values and memberships of the child object (the template object). When the same attribute values or static property values are set on the parent object, those values override those inherited from the child object (the template object). In the static data/attribute grids, inherited values are shown in grey (see screenshot below). These are values that the object will use for the simulation, but the value only exists for the template object. Any dynamic data defined on the template will be automatically inherited by the parent object. If the same properties are defined on both the parent object and child object (template) then the data will not be overridden. It will simply be inherited which could result in duplicate data being defined, and the appropriate warning being issued during the simulation.
 Figure 20: Template Collection
7. Timeslice Editor
The Timeslice editor menu is available for Timeslice class and Timeslice object context menu.
 Figure 21: Timeslice Menu
The Timeslice Editor Window displays the main tree of Timeslice objects on the left. From here, Users can either create Timeslice object or select particular Timeslices to work with. Selecting Timeslice objects will populate the properties grid in the bottom-right. Properties selected in the property grid are displayed on the timeline chart in the top-right.
 Figure 22: Timeslice Grid
Users can adjust the visual representation of Timeslices using the controls from the top part of the Timeslice Editor window, namely: Auto Selection checkbox, Range combo, Resolution combo and View From.
8. Create Change Database
Create Change Database option is available from the File tab (Backstage Menu). It provides a way for Users to create a database which is a subset of a larger database. Such subset databases can be used to "patch" into other related databases.
 Figure 23: Create Change Database
For further details on how to use the functions in PLEXOS GUI, please refer to Change System.
9. LP File Viewer
LP files can be loaded directly from PLEXOS via the open menu now. User can jump within the LP file content by selecting different objects in the tree, using the previous and next ribbon menus and clicking different "JumpTo" buttons. The new LP file viewer provides a convenient regular expression search facility for objects referenced in the file.
For a particular object in the tree, a new "filtered" version of the document can be created in a new tab. The filtered version includes only those expressions in which the object appears.
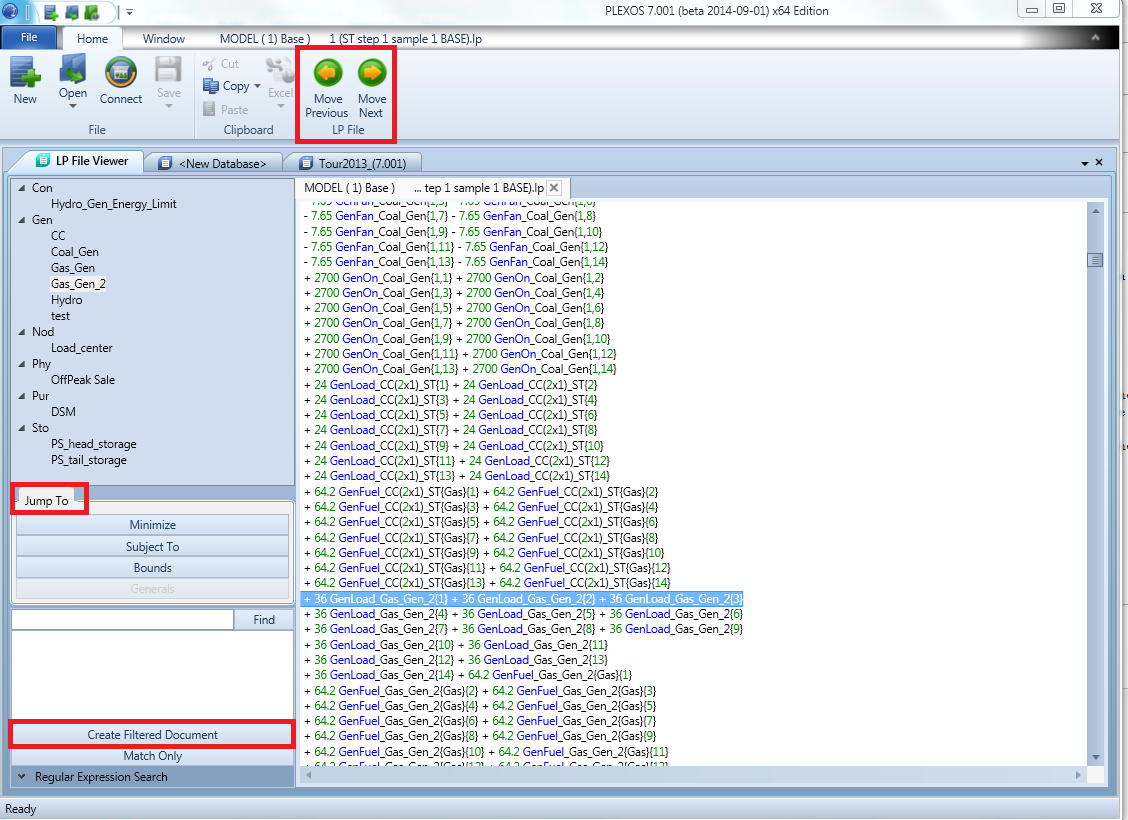 Figure 24: LP File Viewer
Please refer to LP File Viewer for details on LP File Viewer.
10. New Quick Charts
Quick charts are available in chart ribbon tab when opening a solution database. There are some new quick charts in PLEXOS 7 as outlined below:
Confidence Band Chart - A Confidence Band chart indicates the reliability of the estimate. It is accessed from the Chart ribbon, Quick Charts section. In order to be able to call this chart, the solution has to be built using simulations and also include mean values and standard deviations. The User has to select objects, properties, time slices and phases. All of which will be used to build confidence bands (in the image below, confidence bands are built on the generation of three generators).
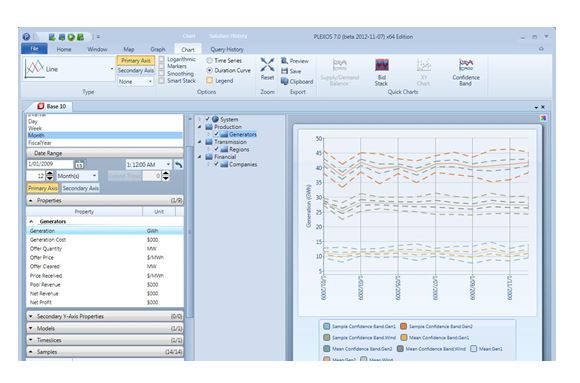 Figure 25: Confidence Bands Chart
Timeline Chart - Initial view of the Timeline Chart shows the time window set in the filters section to the left. As soon as the chart is loaded the User can navigate using the bottom controls. Each time a chart is executed a new chart tab is created. Further chart types be selected from Type selection ribbon combo box.
Please note that this feature has been disabled starting from PLEXOS version 7.3 onwards.
 Figure 26: Timeline Chart
Distribution Chart - The probability distribution charts are used to check if multiple sampling solution data fits to any known distribution from the predefined collection. In order to open the chart, User has to select objects and then a property to be tested. The selected property has to have multiple samples reported. Known distribution is selected from the corresponding combo box in the upper-right corner of the chart. The User can also select the number of columns (bands) of the histogram, set time window of the selection (either first time step or the whole range of dates is used) and select if he wants to use property values as random variables or errors (value - sample_mean).
 Figure 27: Distribution Chart
Gantt Chart - It shows Hours Active for each Maintenance object.
 Figure 28: Gantt Chart
Power Flow Impact Report - It creates a table showing the injection coefficients, injected power flows ranked by absolute value of injection for a selected range of objects, according to generated injection data and control settings. Undocumented Parameter FlowImpact flag needs to be enabled before model execution.
Report is available after selecting Node, Generator, Zone, Hub, Line, Transformer or Interface object from the main tree. In order to run the report corresponding to output files for power flow, injection has to have been created for the analysed solution (refer to Flow Impact section). After selecting the date, time and injecting (child) class, the report is run by clicking "Apply" button.
Results are paged by 50 records, the User can navigate pages using "First", "Prev", "Next" and "Last" buttons. User can also employ text search option opened in the right bottom part of the window. Report can as well be saved to CSV file using "To CSV" button. Further, only selected data are reported when multiple rows are selected by the User.
 Figure 29: Power Flow Impact Report
Please refer to Quick Charts for details on new quick charts.
11. New Query History Ribbon Menu
A separate "Quick History" tab is used to query history function in PLEXOS 7. The tab records all the queries Users have recently executed. This tab can also be used to pin, execute and clear historical queries of any solution window.
 Figure 30: Query History
12. Hydro View
Hydro view provides a graph style visualization function inside PLEXOS GUI for the hydro subsystem. It is available when selecting storage or waterway class (category) within map or graph view.
In the Hydro viewer, water flows go from top of the view down to the bottom, so that head storage is always placed higher while generators and tail storage are always lower. And also "Storage from" is always above "Storage to" of the same waterway.
 Figure 31: Hydro Viewer
13. SLD View
SLD (Single Line Diagram) viewer provides a graph style visualization function inside PLEXOS GUI for the transmission system. It can be enabled in the context menu of node/gas node when selecting node or gas node in object tree or on map/graph inside map/graph viewer.
 Figure 32: SLD Menu on map/graph
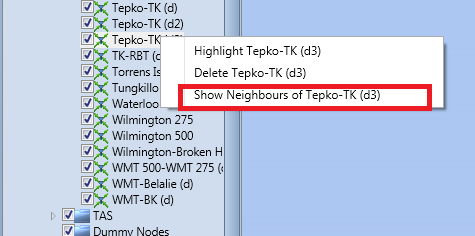 Figure 33: SLD Menu in object tree of map/ graph view
The buses (node or gas node), lines (line, transformer, gas pipeline) and related objects (generator, purchaser, market, physical contract, gas field, gas storage and gas demand) are shown on SLD viewer. The property data of Node[Voltage], Generator[Rating], Line[Max Flow], Gas Field[Initial Volume], Gas Storage[Max Volume), Gas Pipeline[Max Volume], Gas Demand[Demand] and Market[Price] can be displayed on SLD viewer if the "date" checkbox is ticked.
 Figure 34: SLD Viewer with property data
14. Custom Columns
Custom columns can add additional description columns to object grids, which provide more information to differentiate objects. The function is available from Custom Columns tab of Settings ribbon menu window. Any number of additional columns can be added for selected classes.
 Figure 35: Custom Columns Setting
 Figure 36: Custom Columns in object grids
15. Fill Command Enhancement
PLEXOS 7 add advanced options for both property and selection fill command.
 Figure 37: Advanced option menu
Advanced Options allows for various data to be incremented. For selection fill command, the increments occur in parallel for each selected row. For property fill, command Users specify how many iterations they require to increment each value and this is done for each incremental field selected.
 Figure 38: Advanced options of property fill command
 Figure 39: Advanced options of selection fill command
 Figure 40: Dynamic property grids filled with increments
16. Log File viewer
The log file (*.txt) can now be opened by PLEXOS desktop via open ribbon menu directly with an entirely new layout.
The User can select section name in the left tree, or choose section name from drop down list in the bottom right to locate the specific paragraph. The User can also use the regular expression to search and locate specific alpha-numeric value.
 Figure 41: Log File Viewer
17. Action and Expression
Previously in PLEXOS 6, the User can tag dynamic properties with condition, escalator and variable. This behaviour has changed in PLEXOS 7. Currently we only have the Variable class, Condition and Escalator objects defined in PLEXOS 6 database will be converted to variables on upgrade. In dynamic properties grid, there are now action and expression columns instead of the previous three (3) columns. The User can put in a variable in the Expression column whilst the action column is used to specify the logical operation in relation to the variable logged in expression column.
 Figure 42: Action and Expression columns
18. New Ribbon Function of Configuration Window
Some new ribbon menus for configuration window are added in PLEXOS 7 GUI.
 Figure 43: Config Window New Ribbon Menu
Sort by name - Properties and Attributes in the Config Tree are by default ordered in such a way that the most commonly used Properties are towards the top of their sub-tree. We can change to sorting by Name with this Ribbon button. It was previously available in context menu on right clicking selected category in config tree.
Disable Unused - It will disable any Properties which do not have any data value. (Attributes are not affected.)
Dynamic->Static - Any enabled Properties which are Dynamic and have only one value (with no qualifying dates or tags) will be converted to a Static property.
Property Tags - Property Tags will group related Properties. Selecting one or more tags will highlight the Properties in the tree which are tagged with the selected tags so that they are easy to locate.
19. Record Action
The new function is placed under file ribbon tab. It allows for the screen capture video recording of the User's interaction with the PLEXOS GUI. In order to utilize this feature, Microsoft Expression Encoder 4 and Xvid Video Codec have to be installed.
 Figure 44: Record Action
20. Ribbon Context Menu
PLEXOS 7 shows context menu in a separate ribbon menu tab when the User selects class, category, object, membership and grids. Also for some windows other than main user interface, a separate ribbon menu tab will be displayed.
 Figure 45: Context Ribbon Menu
21. Scenario Read Order
Scenario[Read Order] Property defines the order in which to read scenario data (last read scenario has highest priority). When there are multiple scenarios in a model, the scenario with higher [Read Order] value will have higher priority to be read. Also the scenarios will display from top to bottom according to read order in membership window and properties window. The scenario with higher [Read Order] is placed at a higher position.
 Figure 46: Scenario read order value
 Figure 47: Scenario order in membership window
 Figure 48: Scenario order in properties window
Please refer to Scenario read order for details on scenario read order.
22. Report Data Size Estimation
The function is located in report object settings window. The size is estimated by calculating the number of objects, properties enabled, selected phases, statistical modes, number of samples and reporting type selected for the particular model. The estimation value is not accurate but indicative of a file size. Calculations do not consider multiple band data or timeslices. The reported value is the summation of those models with this reporting feature which are set to be executed.
 Figure 49: Report data size estimation
23. Paste all Query Results to Excel
This function is available in the drop down list of excel ribbon menu when opening a solution database. Previously, Users could only paste one query result data tab of solution database into excel at once. This new function enables the User to export multiple data tabs at once.
 Figure 50: Paste multiple tabs
 Figure 51: Pasted multiple tabs
24. Category Bulk Editing
There is a new function inside categorize window - "Category Grid". This button opens a grid, allowing us to make bulk changes to the categories across the whole database.
 Figure 52: Category Grid button
 Figure 53: Category Grid window
25. Export Database Comparison Result to Excel
In the database comparison tool, there is a new function which can export the differences to excel. It can be opened from ribbon menu.
 Figure 54: Export differences to excel
26. Execute to CSV
To save time and perhaps avoid an unnecessary extra step, execute to CSV populates a .csv (comma separated values) file with data queried by the User, without populating the data grid pane. It can be accessed from the Solution section of the Home ribbon. The new function enables the User to execute the query result directly to a csv file which is located under solution database folder.
 Figure 55: Execute to CSV
27. Periods Total/ List Total
Periods total aggregation option performs summing selected data by all periods. The option is available from Home ribbon tab and works in a similar way to Total and Category Total, except that summing is by periods only. In order to query Periods Total, the User has to make regular filtering of the left-hand side controls to define what data will be summarized, then press Periods Total button.
 Figure 56: Periods Total
List total aggregation option summarizes data by the list. The option is located in home ribbon tab and is available when Users select properties of objects inside a list in tree of solution database.
 Figure 57: List Total
28. New Ribbon Menu of Chart Tab
Trend line - For regular charts, the User can add automatic trend lines by selecting the type of trend line from Trend Types combo box. Currently, the User can select between linear, polynomial (second order), exponential, power, Fourier, logarithmic and moving average (averaged by 5 points). Once the trend type is selected, the User can see trend lines on the chart and trends equations in the label section. Equation coefficients can be copied to the clipboard by right clicking the trend's label. The data is copied in csv format and then pasted by the User.
 Figure 58: Trends line and trend equation
Trends can also be extended by a desired number of periods. The User selects the number of periods and presses Extend Trend button. On the image below, trend was extended by 10 months (since type of period is month).
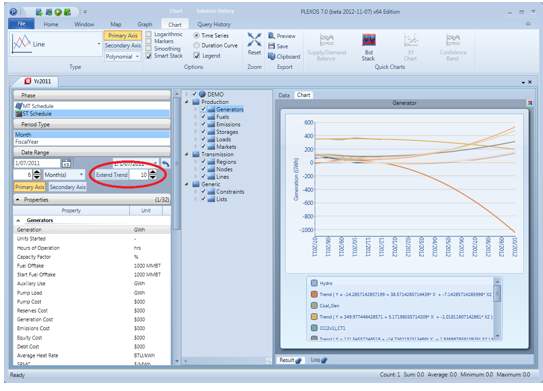 Figure 59: Extend Trends line
Note: Trends cannot be accessed for stacked charts.
Series tooltips - The check box displays the name of the series as well as the data value when cursor hovers over the series chart.
 Figure 60: Series Tooltips
Present value - The checkbox enables the User to calculate the Net Present Value of a stream of Cash Flows. The cash flow for a period represents the net change in money of that period. Calculating the net present value (NPV) of a stream of cash flows consists of discounting each cash flow to the present, using the Present Value Factor and the appropriate number of compounding periods, and combining these values. Each result tab holding values calculated as present value has an additional "(Present Values)" to its header.
Note:- Only properties with '$' symbol in their unit field and without a '/' symbol (prices have "$/smth" and aren't used for PV calculations) are processed, all other data is ignored.
- Present value calculations only applies to regular chart and does not apply to quick charts.
- A present value calculation does not apply for Interval data.
 Figure 61: Present Value
Please refer to New chart ribbon menus for details on new chart ribbon menus.
29. Auto Save
"Auto save" function can be accessed from settings menu file tab.
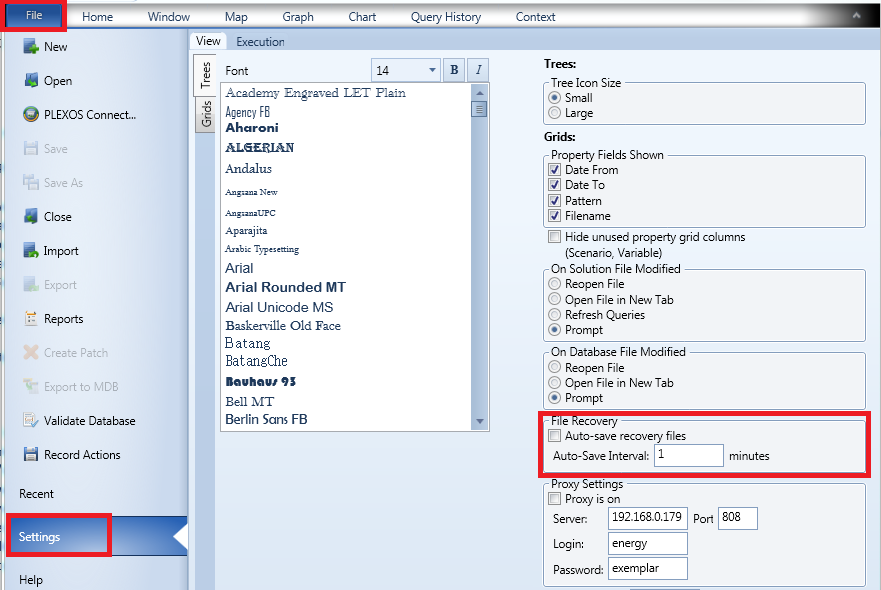 Figure 62: Auto Save Check box
After enabling the function, it will save a copy of latest database version in a temp folder within every period of the defined auto-save interval. Once Users meet with some unusual closure of the application, when reopening PLEXOS, automatically saved database can be recovered from a list.
 Figure 63: Auto Save Recovery List
30. Proxy Setting
For map visualization features, Users should connect to the internet to get map information. By using the proxy settings in settings menu of file tab, Users can setup the proxy for the internet.
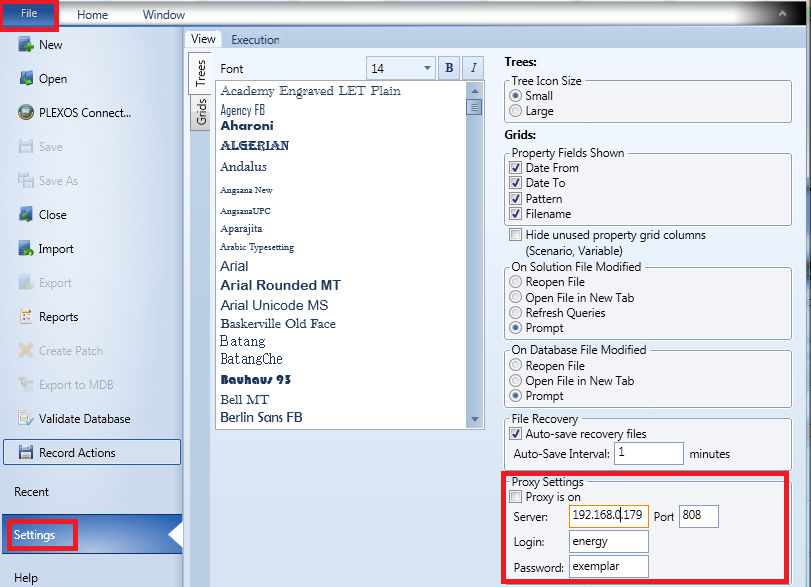 Figure 64: Proxy Settings
31. New Data File Viewer
A totally new GUI is implemented for data file viewer in PLEXOS 7.1. The new window is accessed the same way as before by "View File" context menu of data file object or "View" button within "Build" window.
Data file chart all through the periods of base profile and filename can be viewed. Apart from being zoomed in and out by the mouse wheel, the displayed chart can also be manipulated by adjusting selected length of timeline. Also, the logarithmic data and 3D chart are supported.
 Figure 65: New Data File Viewer
 Figure 66: New Data Viewer: Duration Chart
 Figure 67: New Data file Viewer
 Figure 68: New Data file Viewer: 3D Chart
 Figure 69: New Data file Viewer: Annual Summary Chart
Additionally, some new charts are added. Charts for series details can be accessed by choosing the series and clicking "Details" button on the bottom right of data file viewer. The detail of every series can be viewed with density map, hourly distribution and monthly distribution chart.
 Figure 70: New Data file Viewer: Charts for series details
Data Interpretation
The actual data file view you would see in charts depends on a few factors, such as whether the data file is in the format of "Name in Column" and whether the same data file is linked to multiple objects.
If data file is NOT "Name in Column" format: The same whole value set of each band will be applied to all linked objects (if any). If there are linked objects, the chart will show object name(s) in legend. Otherwise, the data file object name will be shown.
If data file IS "Name in Column: The chart will output one series for each linked objects (if any) with object's name in the legend. If object's name cannot be found in data file's "Name" column, the value for each series will be 0 or a default value (depending on data file configuration). If there is no matching name can be found, the data file viewer will output one series for each band with the name of data file object itself.
32. Change System
The new change system enables users to create and import changed database freely if the base database and changed database share the same ancestor. Any objects, memberships, attributes and properties can be merged.
The functions are located in backstage menus under file tab.
For further details on how to use the functions in PLEXOS GUI, please refer to Change System.
33. Solution Statistics
A new feature has been introduced in PLEXOS 7.2 to enrich the view of solution results in the form of statistics.
This feature can be opened by clicking the "Statistics" button located under the "Quick Chart" ribbon control, or by choosing "Statistics" in the right-click menu of solution execution results.
The following sample depicts the Statistics of Load Series:
 Figure 69: Solution Statistics: Charts for Load series
For further details on how to use the function in PLEXOS GUI, please refer to Solution Statistics.
34. Convergence Chart
A new convergence chart type has been implemented and is available for any multi-sample series data. The following figure is an example of the convergence chart:
 Figure 70: Convergence Chart
For more details on how to use the function in PLEXOS GUI, please refer to Convergence Chart.