
It will ask you to add your Solution data if a report is not available.
2. Click on ADD SOLUTION TO BI ANALYTICS. It will take a few minutes to process the request. You can see the in progress status as shown in the image below.
Last updated on: December 13, 2024
The BI Analytics feature in PLEXOS Cloud enables easy publication of Solution data to a robust BI reporting and dashboarding tool. This is a valuable addition to PLEXOS Cloud that empowers managers and stakeholders to analyze outputs through customizable dashboards.
In the latest release, we have added the ability to edit reports. Previously, the feature only allowed viewing reports. It is now available under the Analytics bundle ( License types) of PLEXOS Cloud. For a comprehensive list of features available in the BI Analytics Dashboard, please refer to the table below:
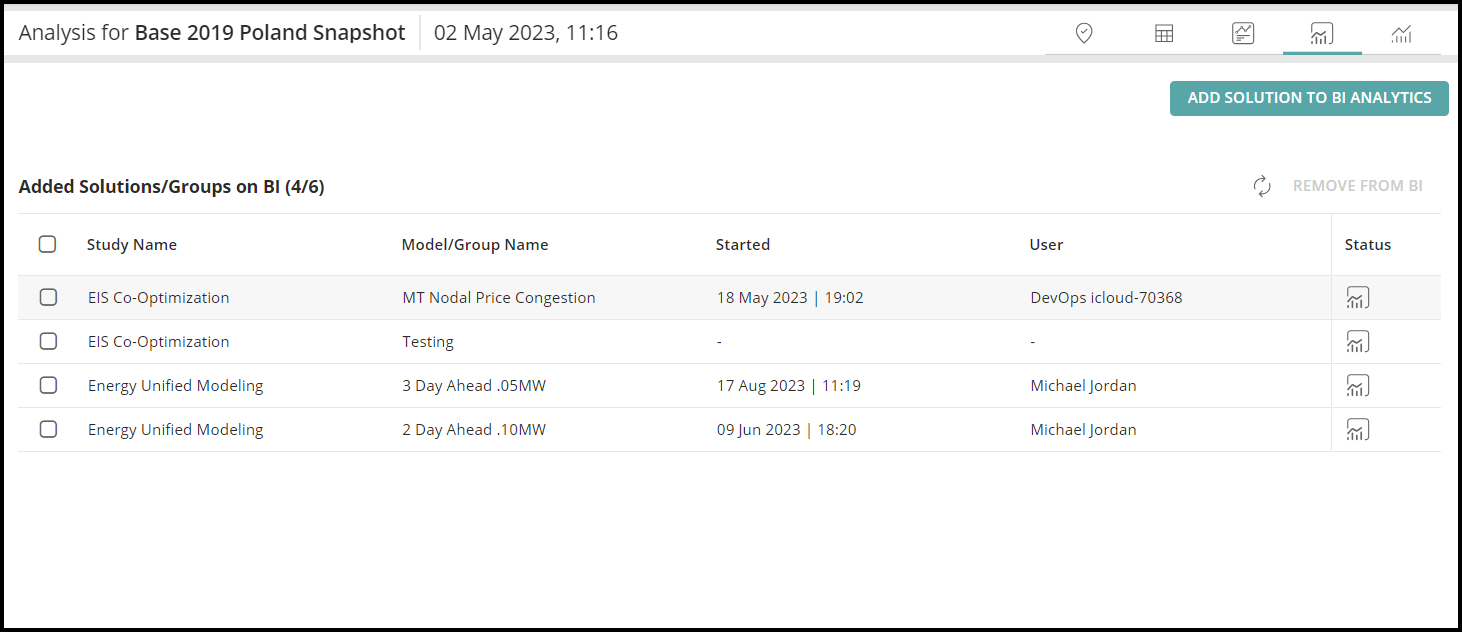
1. To navigate to BI Reports, go to a successful solution and click on the BI Analytics icon
It will ask you to add your Solution data if a report is not available.
2. Click on ADD SOLUTION TO BI ANALYTICS. It will take a few minutes to process the request. You can see the in progress status as shown in the image below.
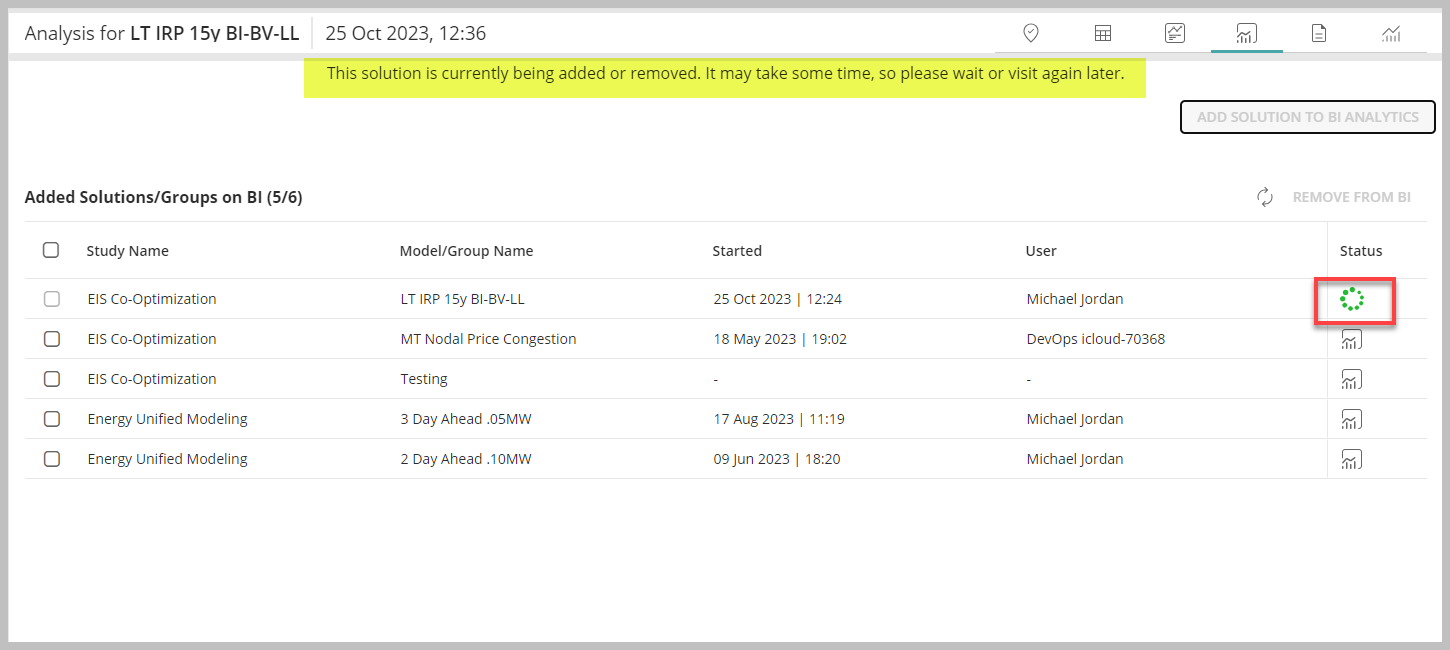
3. You can refresh the page by clicking on refresh icon above until it loads the data. Once it is done, you can see the EE BI Reports and Custom Reports (My Reports).
4. You can also publish BI Reports directly from the Solutions Card action menu. Refer to the section Solutions Card Action Menu to learn more.
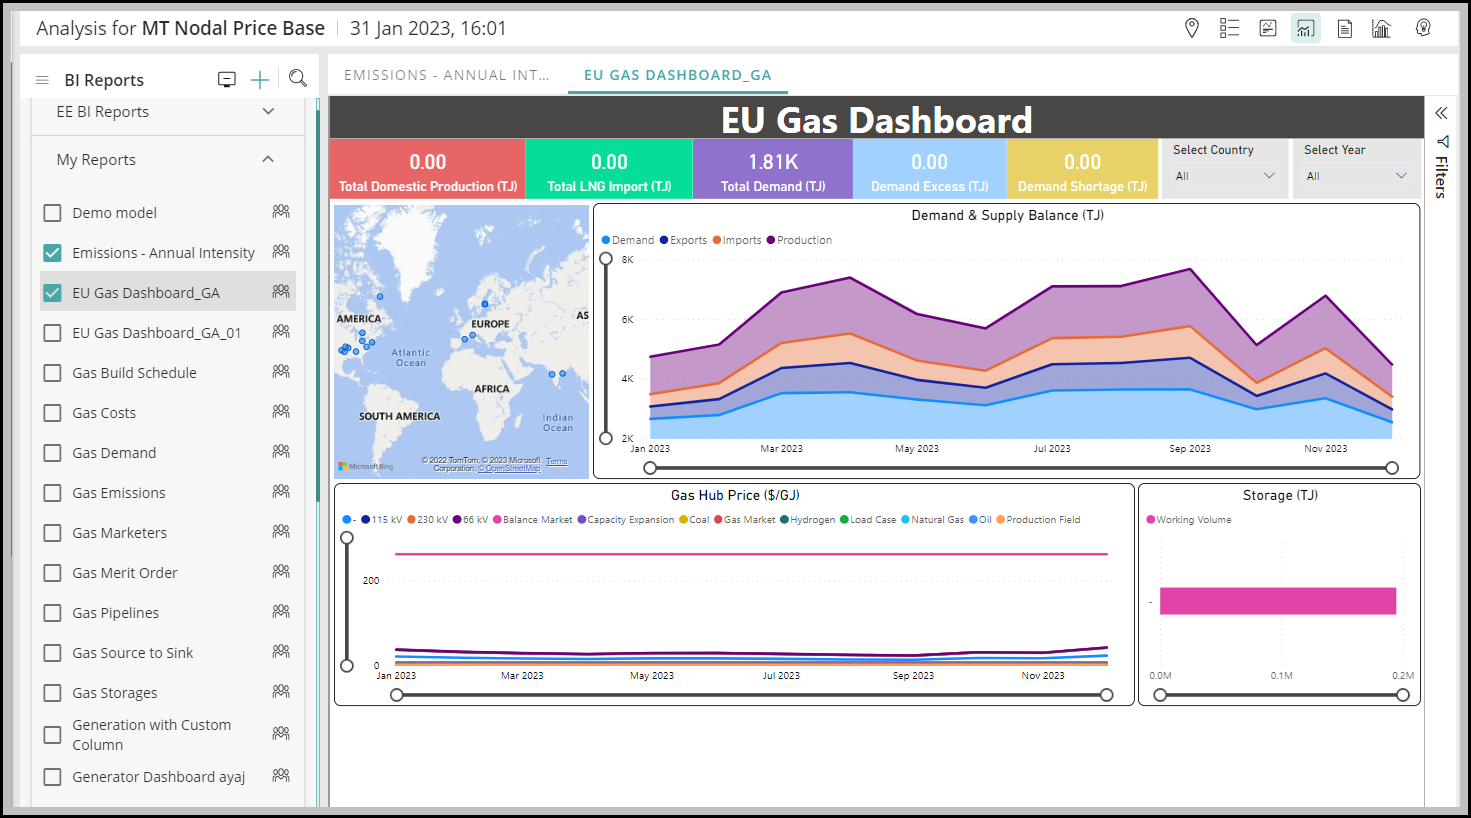
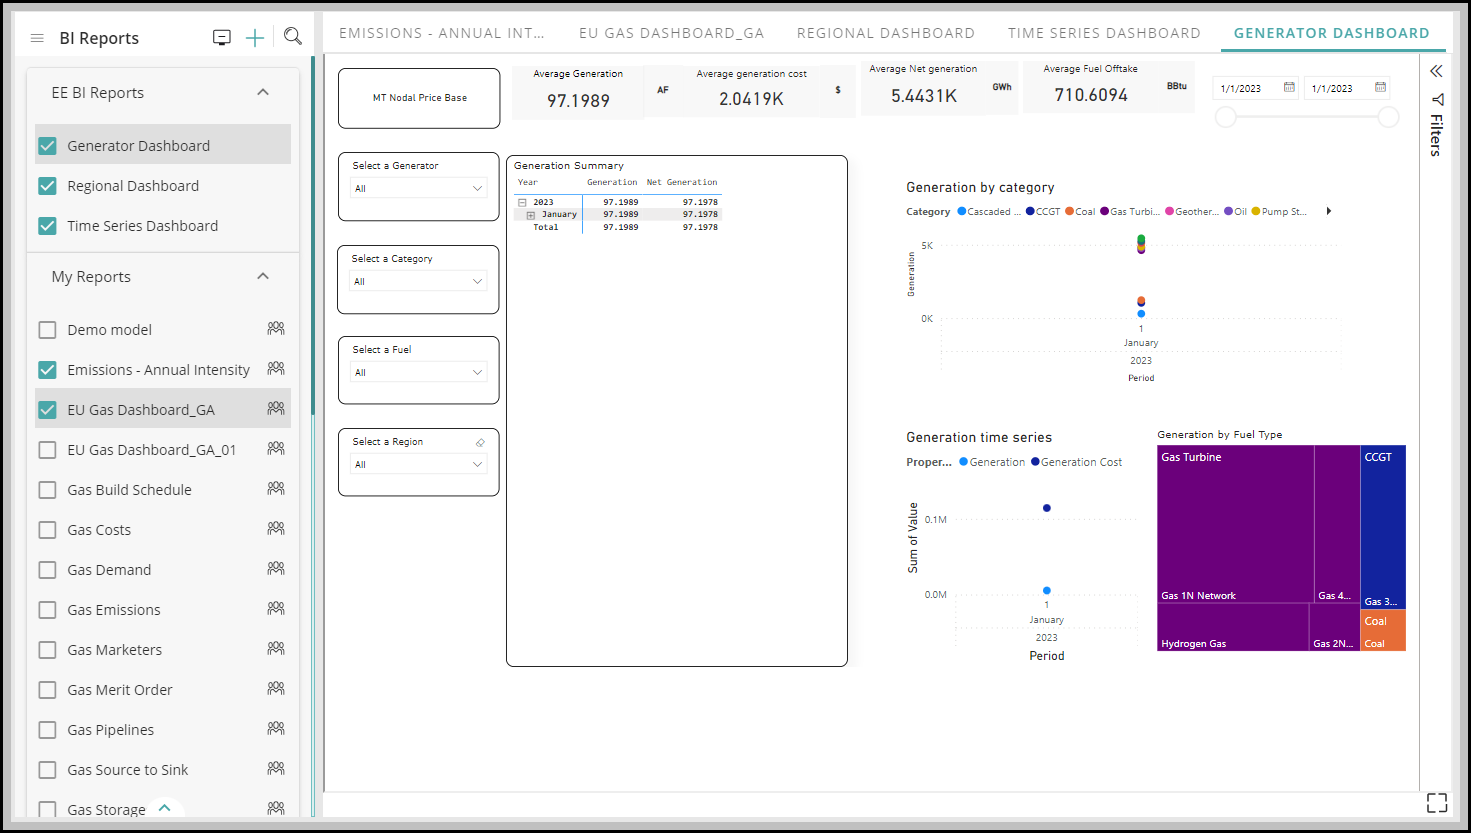
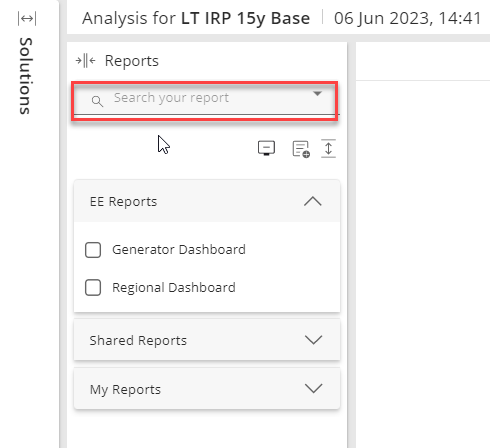
5. Click on the drop-down to see the list of EE Reports. The reports shown here are alphabetically sorted.
As you scroll, it will show you all the available reports.
Select the Reports that you want to view by clicking on any of the checkboxes next to them. You can get the results as shown in the images below.
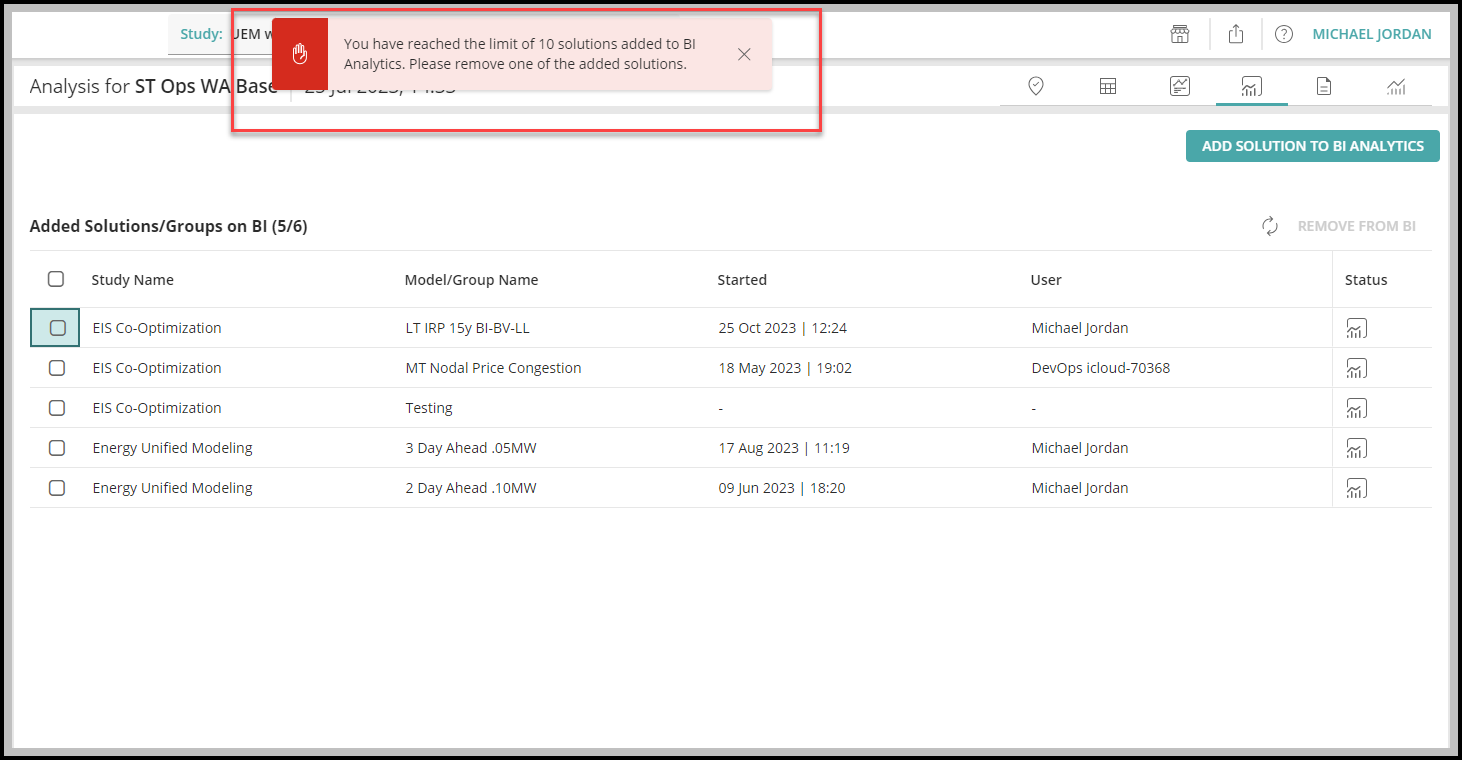
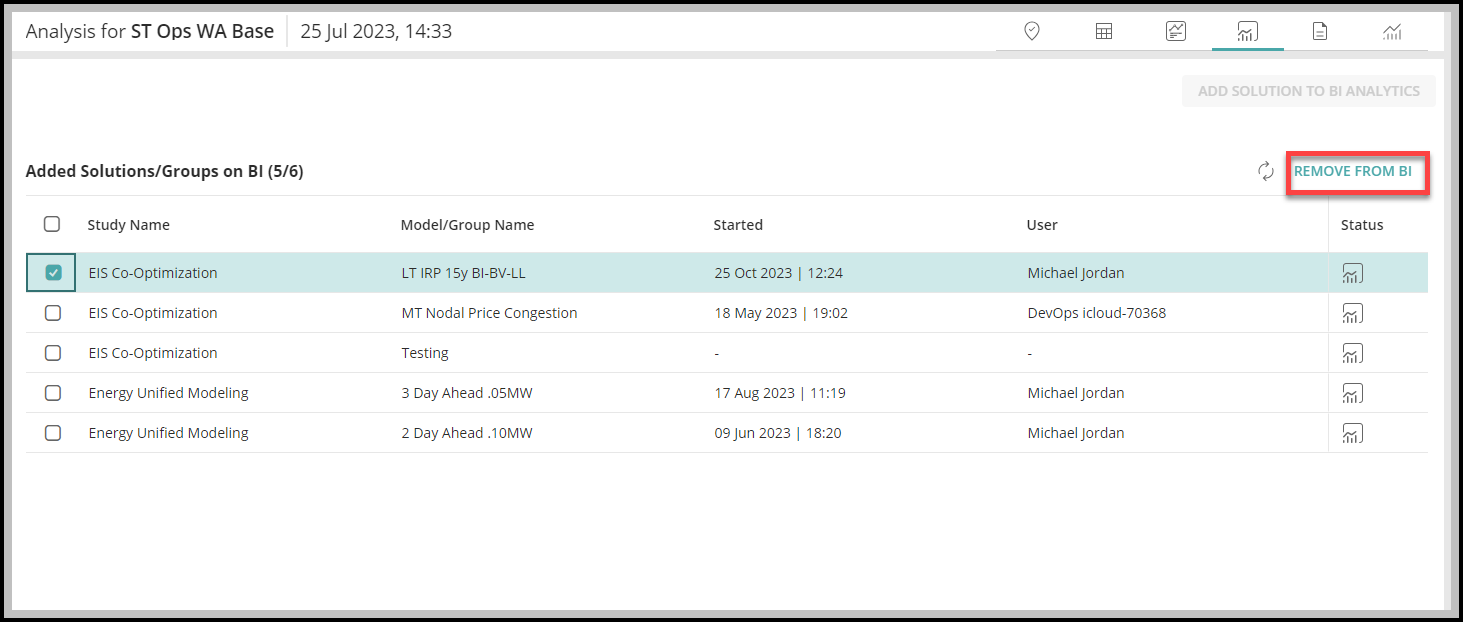
Once you reach the limit of adding the Solution to BI, a warning message pops up that you have reached the limit of solutions published to Power BI and you need to remove any of the added solution as shown in the below image.
1. Select any of the Solution from the displayed list to remove and click REMOVE FROM BI as shown in the below image.
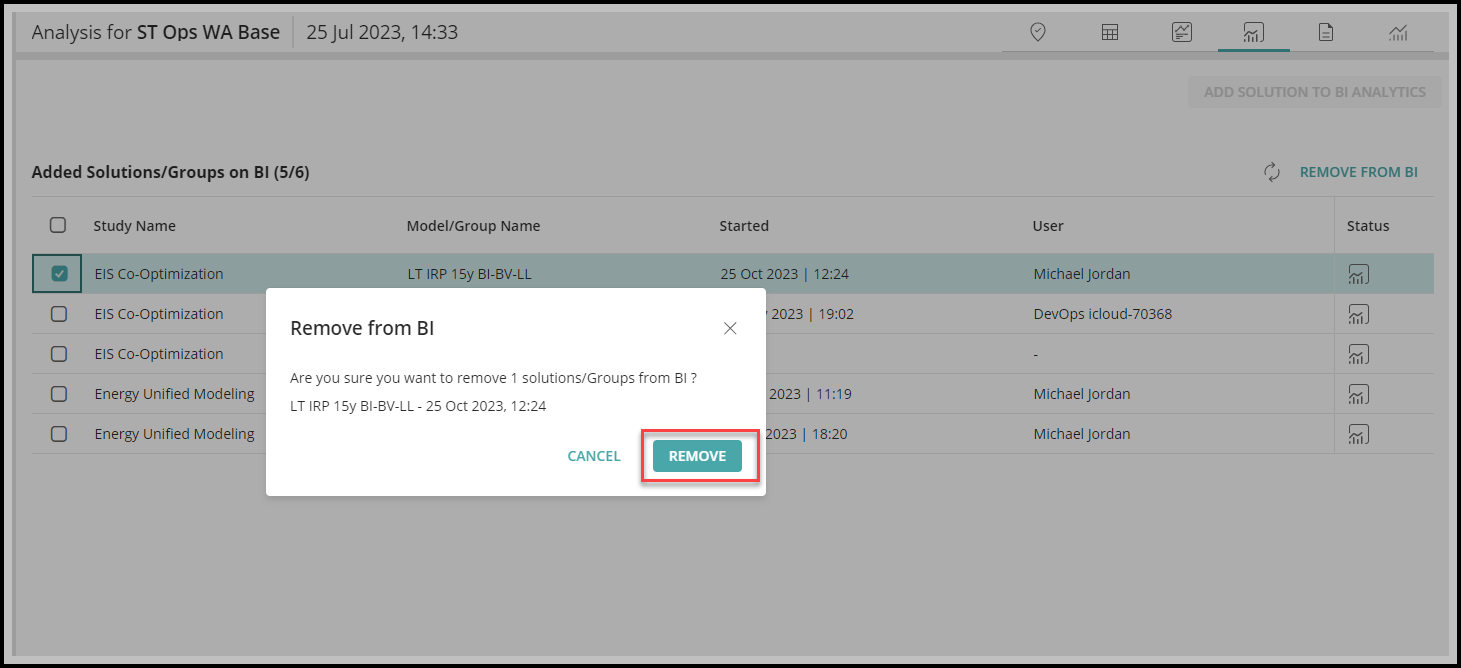
2. A pop-up will appear to confirm; click on REMOVE to proceed.
3. It will take a few minutes to complete; you can see the status - Removal in progress as shown in the image below.
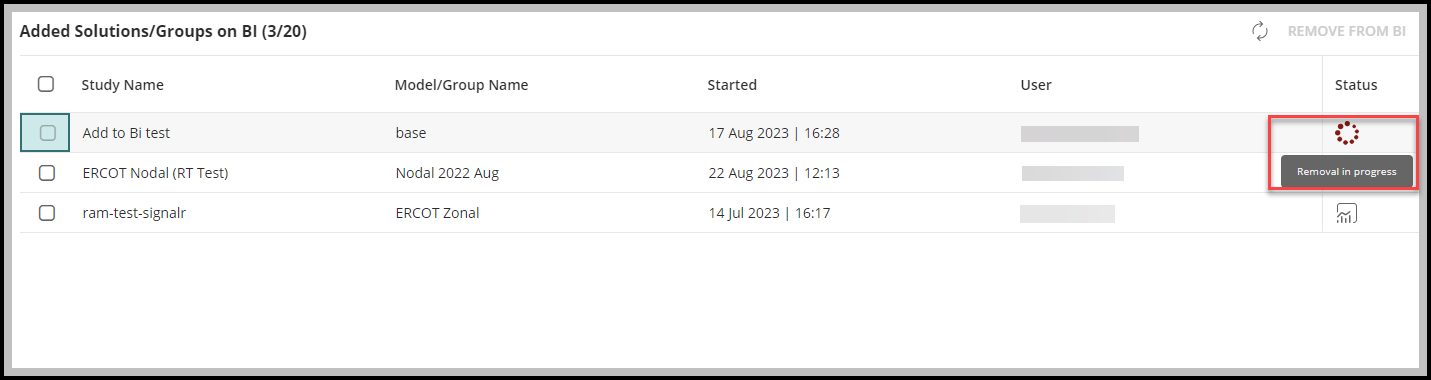
4. It will require a few refreshes to reflect the change. After it is done, you will be able to see the ADD button once again.
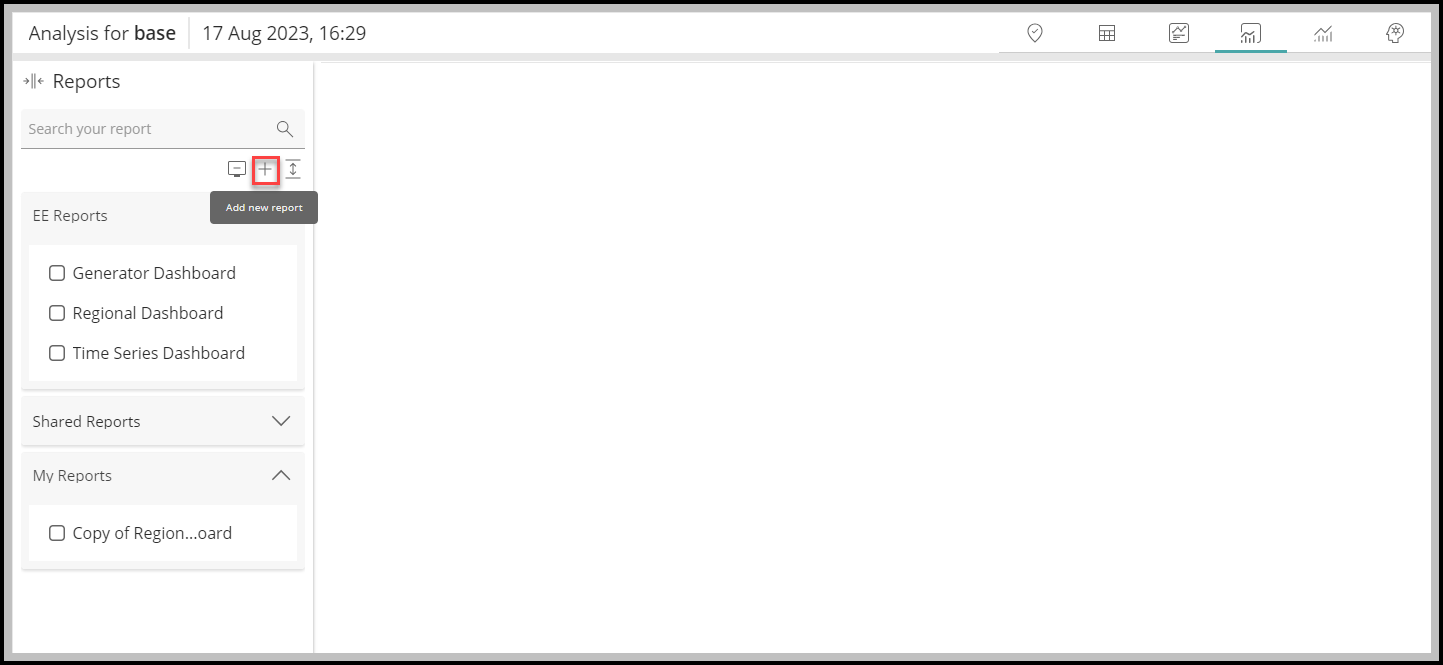
With BI, you can create a new customized report or edit existing the existing Reports created by you.
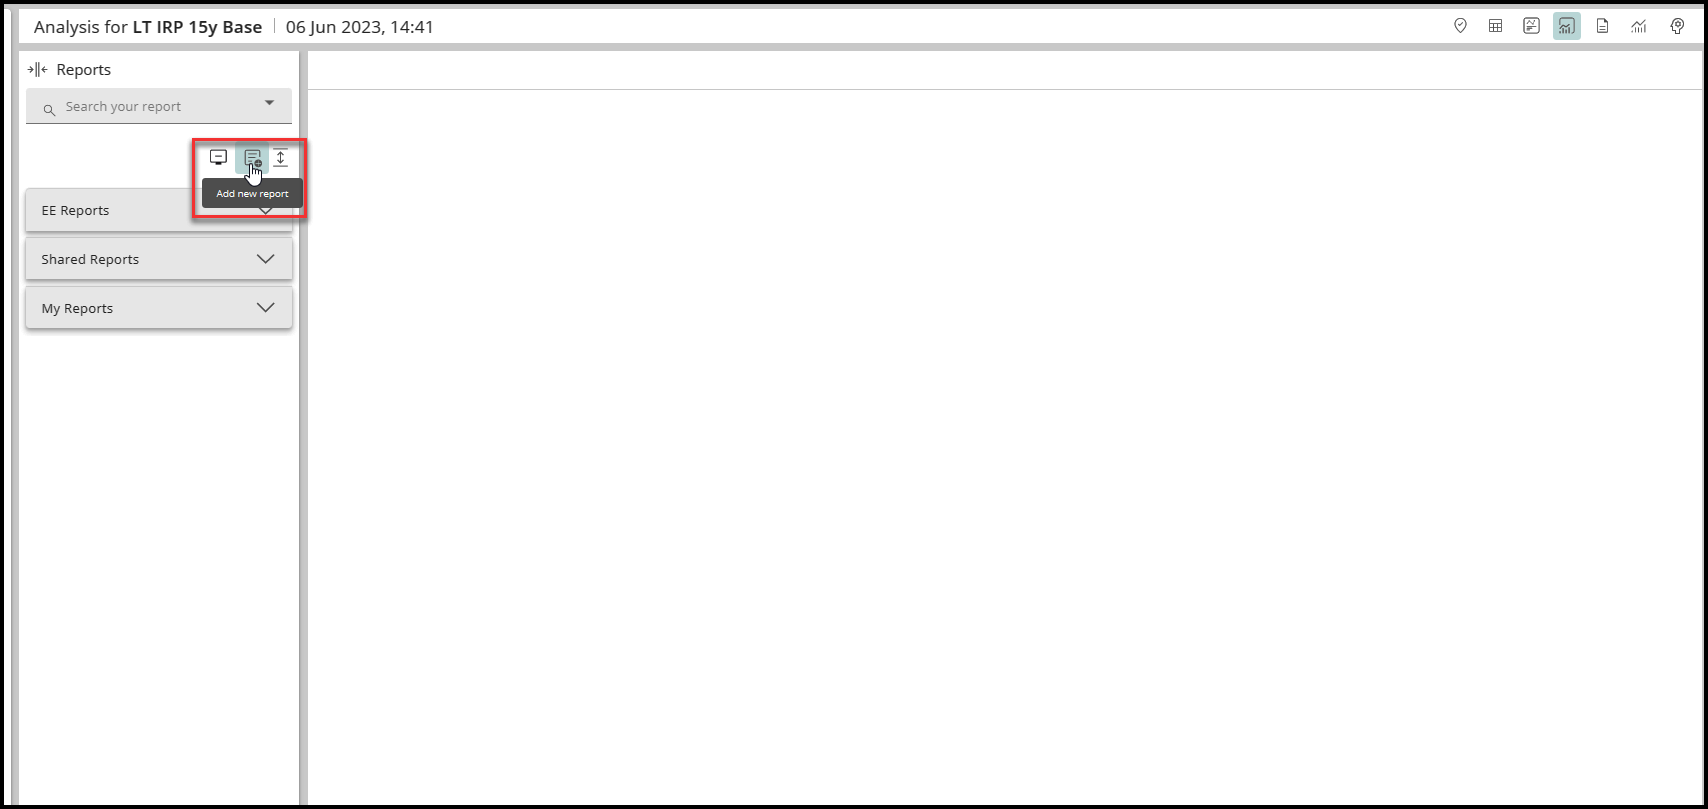
To create a new Report, follow the steps below:
1. Click on the '+' icon to add a new Report.
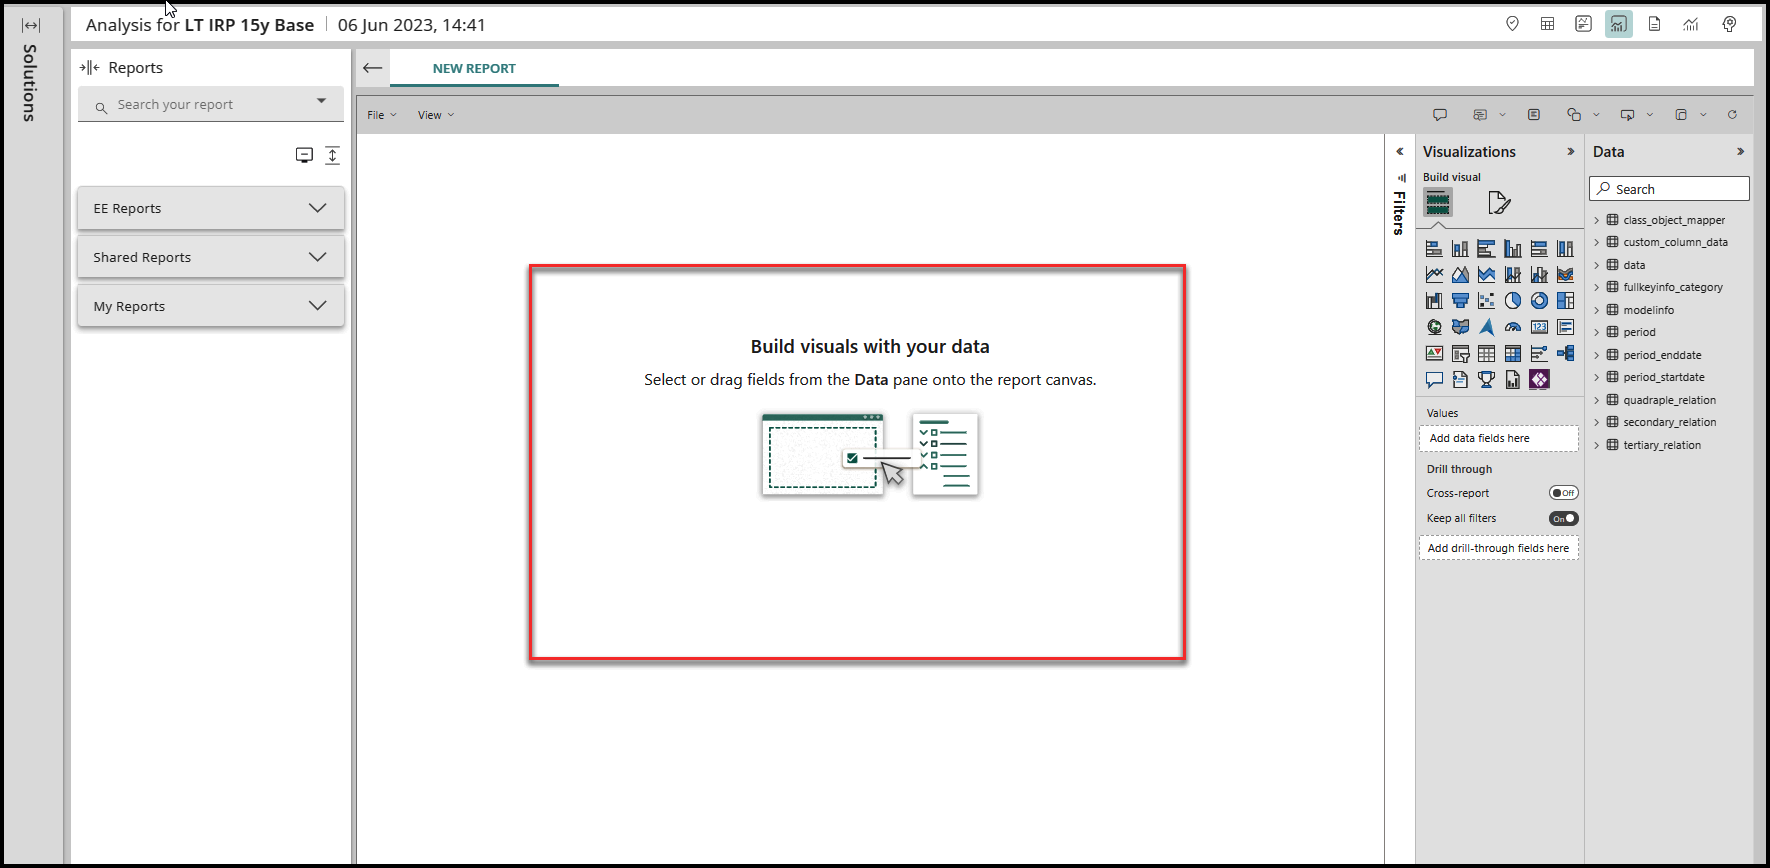
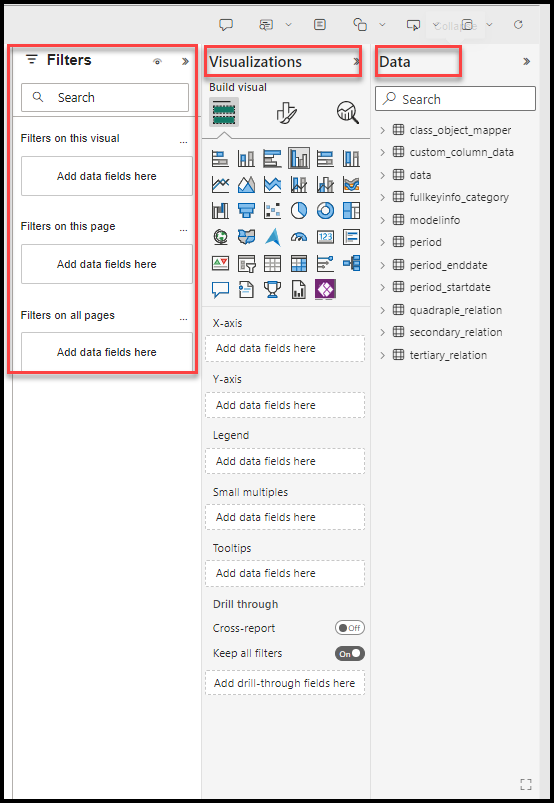
2. It will open the editor with all the options to be used in the report, such as type of Visualizations, Data, and Values.
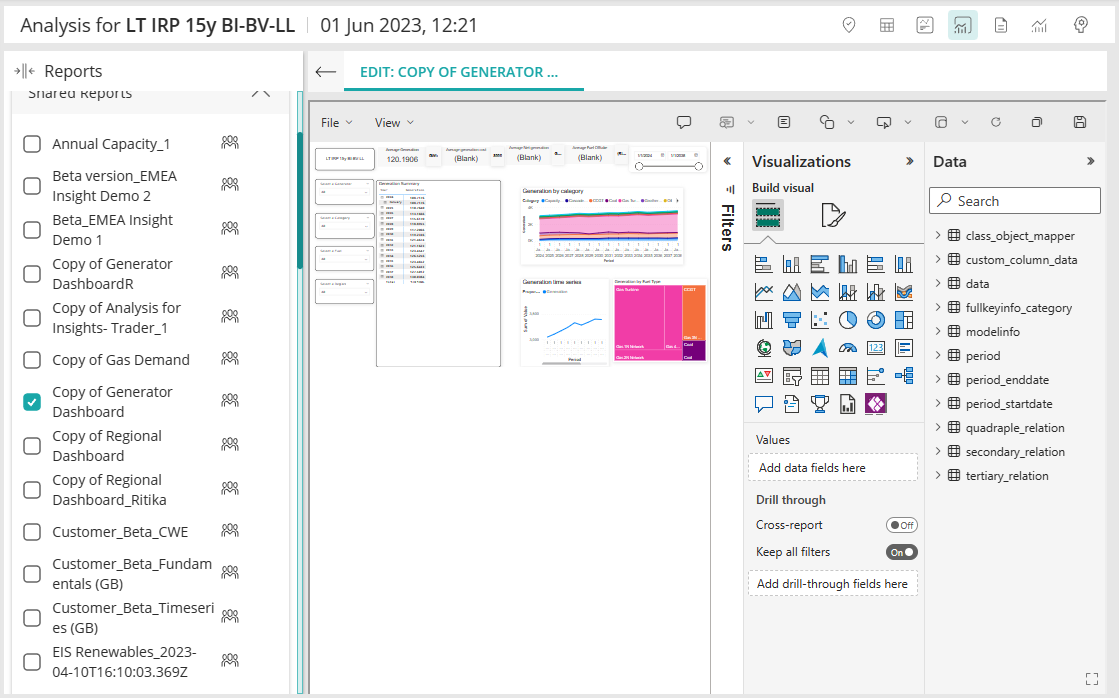
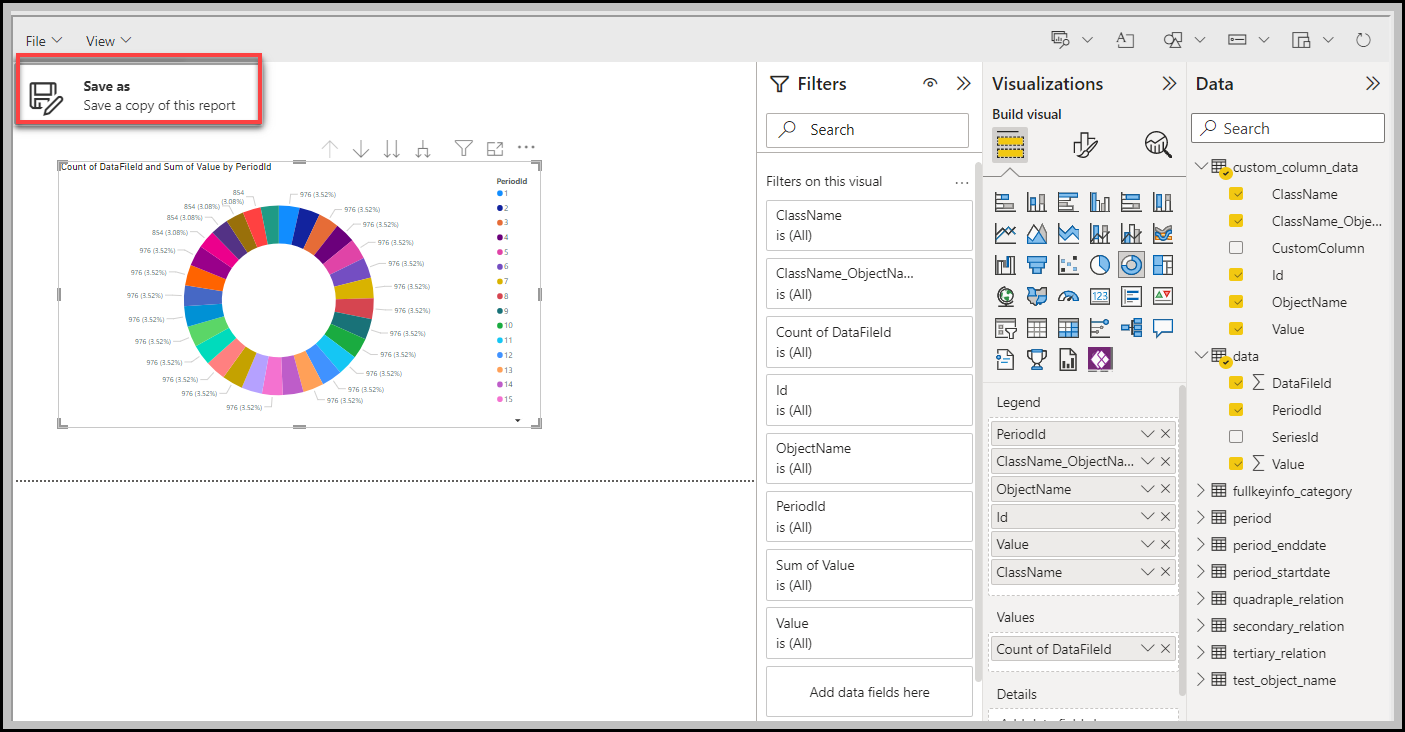
3. Select the visualization type from the right-side editor window by clicking any of them. For example, in the image below the selected visualization type is 'Stacked Column Chart'.
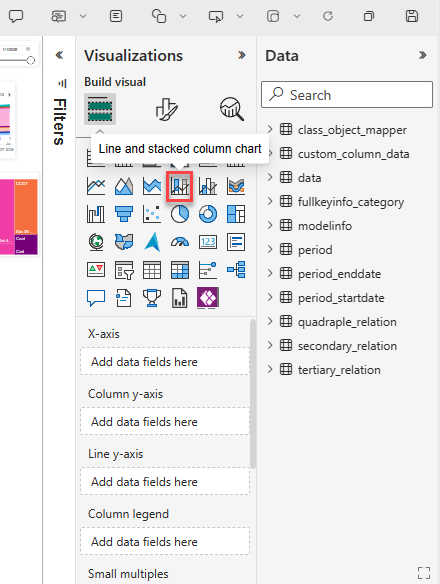
4. Now select the required fields such as Data, Class type, Properties, etc.
5. You can switch to focus mode by clicking on the focus icon located in the top right of the chart.
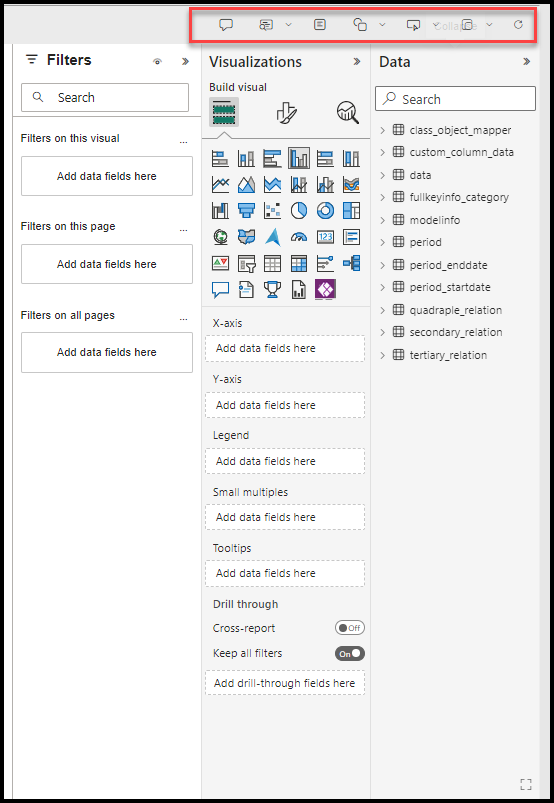
6. There are some more editing options available in the top right menu of the editor window. See the image below for reference.
7. To save your report, click on File and then Save As.
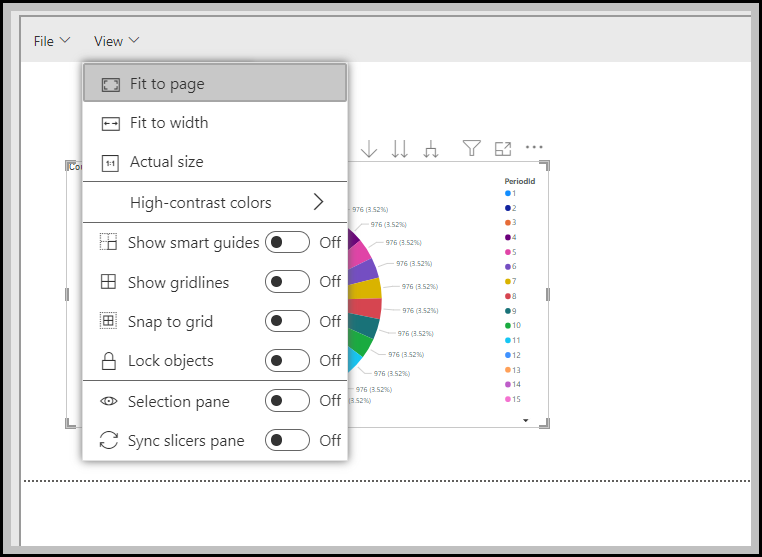
8. To adjust the settings of how you want your report to look, click on the View settings drop-down beside File. It has options as shown in the image below.
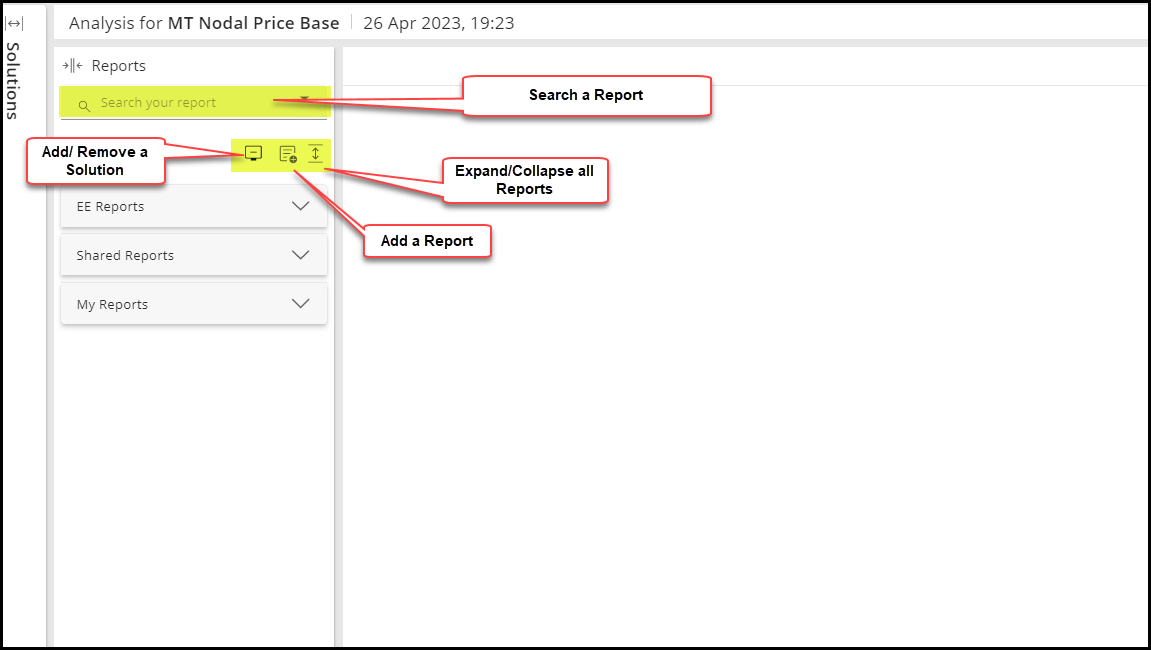
To search the existing reports, click on the search icon on the extreme right of the BI Reports.
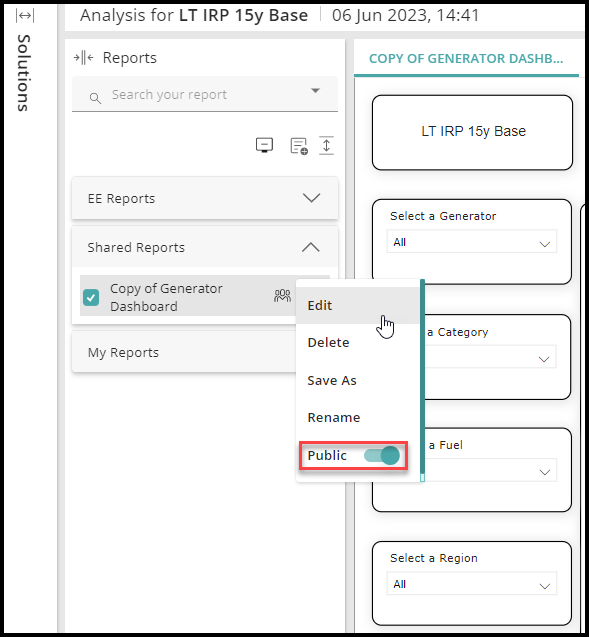
To edit the existing Custom reports, follow the steps below
1. Right-click on the report you want to edit.
2. You will see the Edit option, click on that. It will open the editor mode.
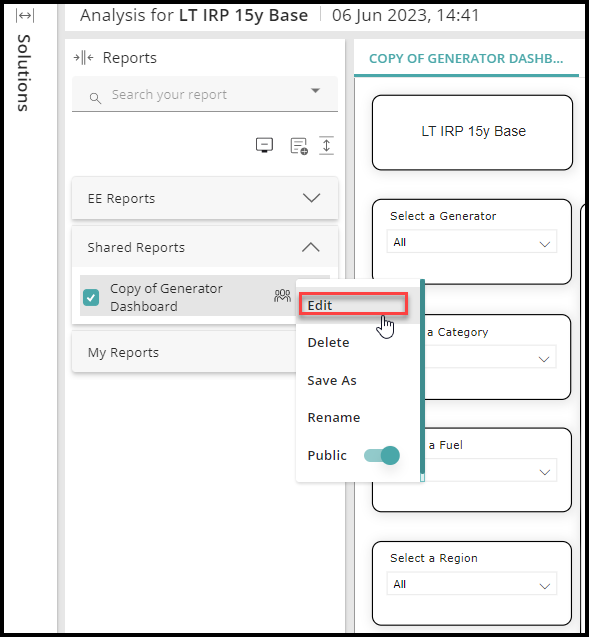
3. To make your report Public, enable the slider, or if you want it private click the slider to disable public mode.
You can switch to Full-screen mode for a better view of your reports while editing, creating, and viewing.
For a full-screen mode, click on maximize icon as shown below
Click minimize icon to return to the original view.
NOTE: Currently, this feature is in Beta and only available to limited customers. Please contact your account manager if you are interested in seeing a demo or participating in the Beta.
Additionally, the GA version will be an optional paid component of PLEXOS Cloud.
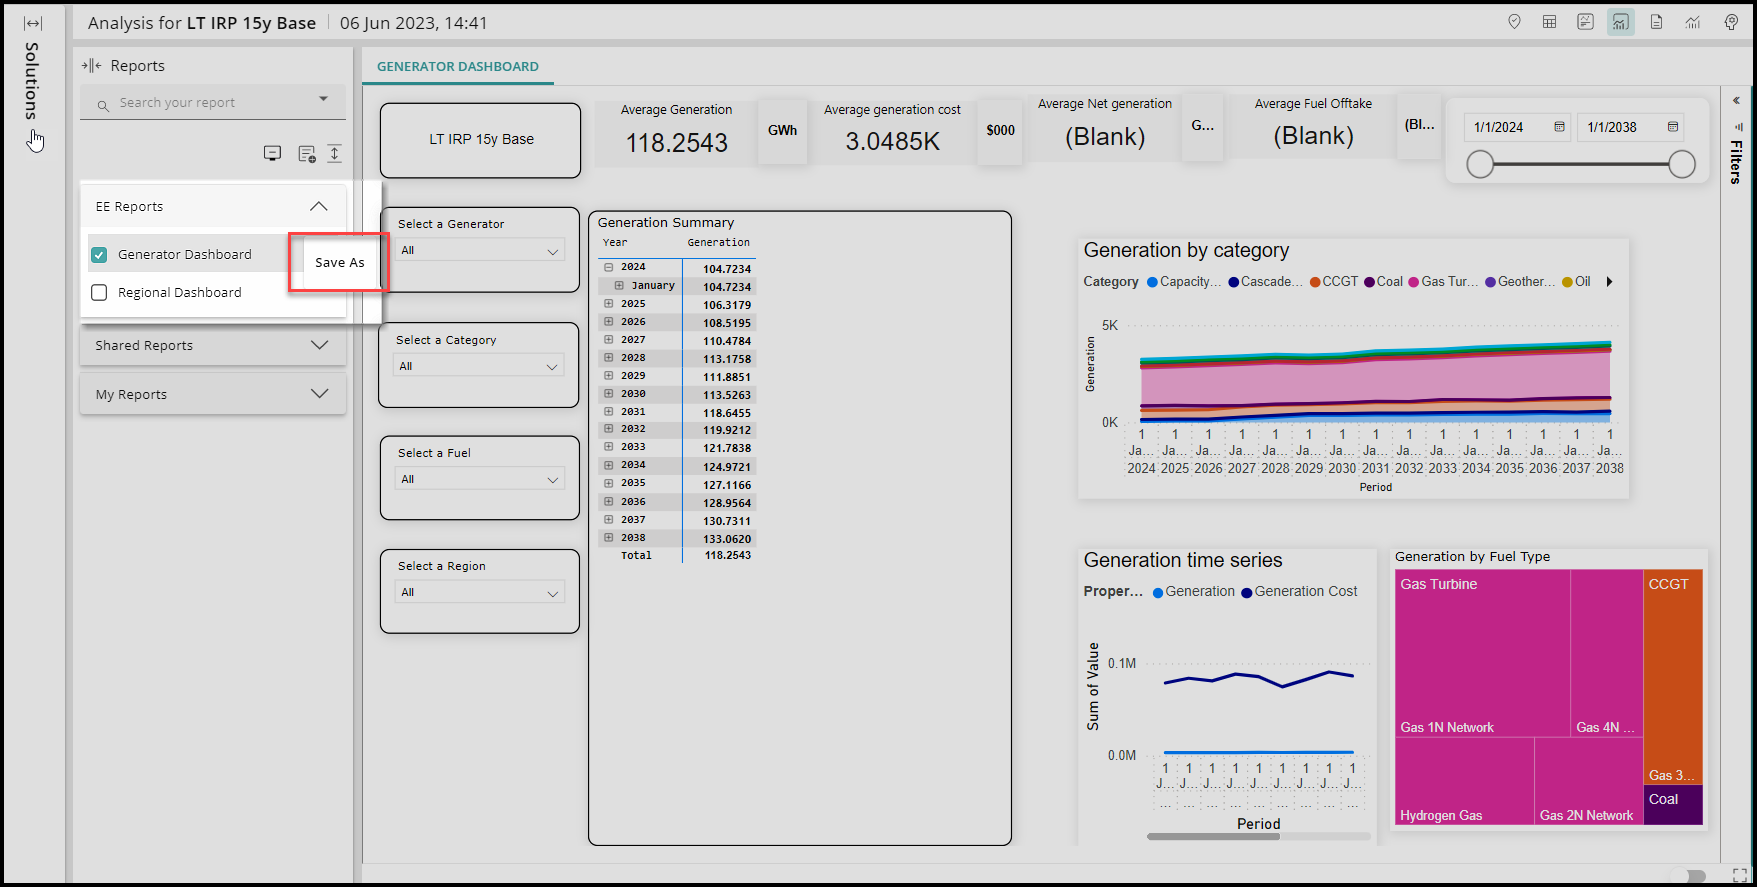
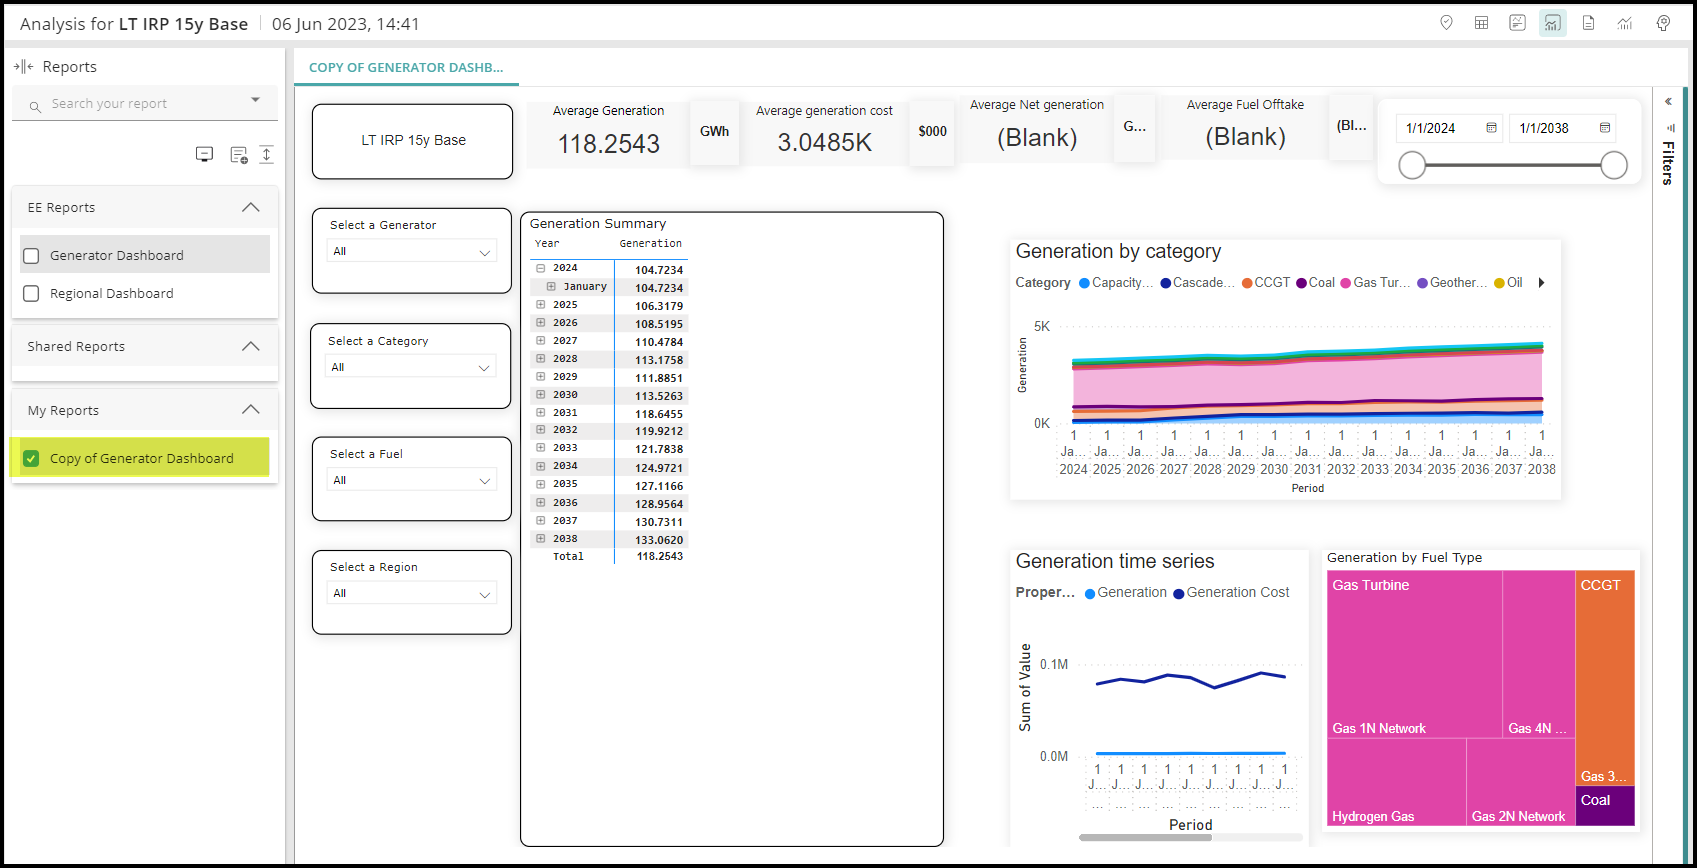
In the March 2023 release, we have added ‘Save As’ option for all the BI Reports - EE BI Reports, Shared Reports, and My Reports.
This option allows you to make a copy of your existing BI Reports. This is an added advantage that makes editing in BI Reports easier by keeping the original copy safe.
To make a copy of your BI Reports,
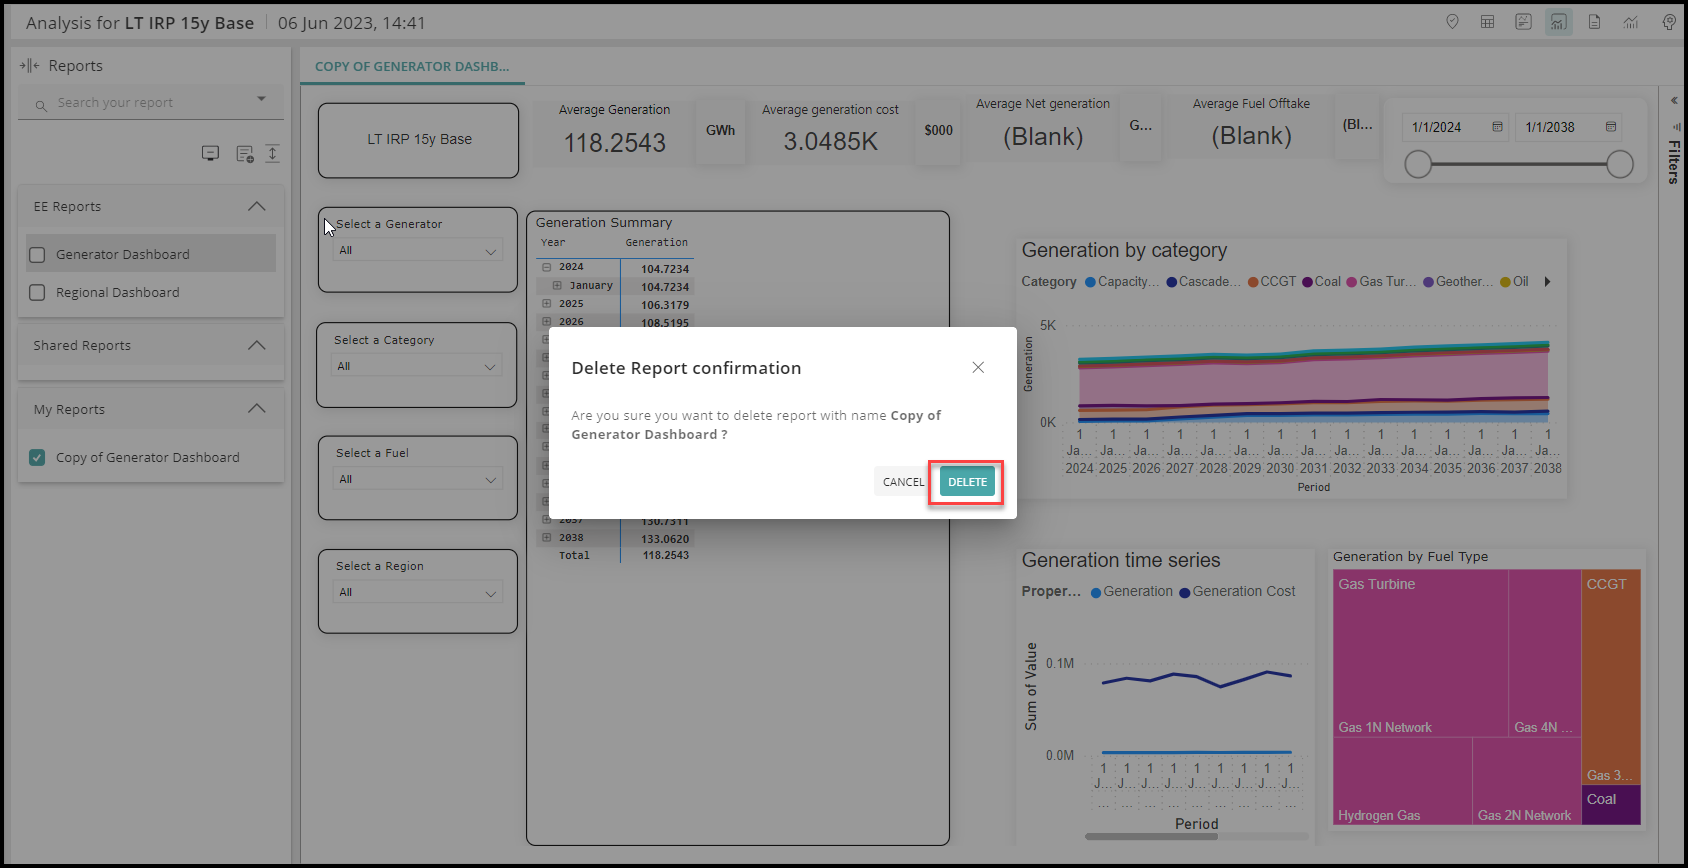
All custom Reports, including those under Shared Reports and My Reports, can be deleted.
To delete a BI Report:
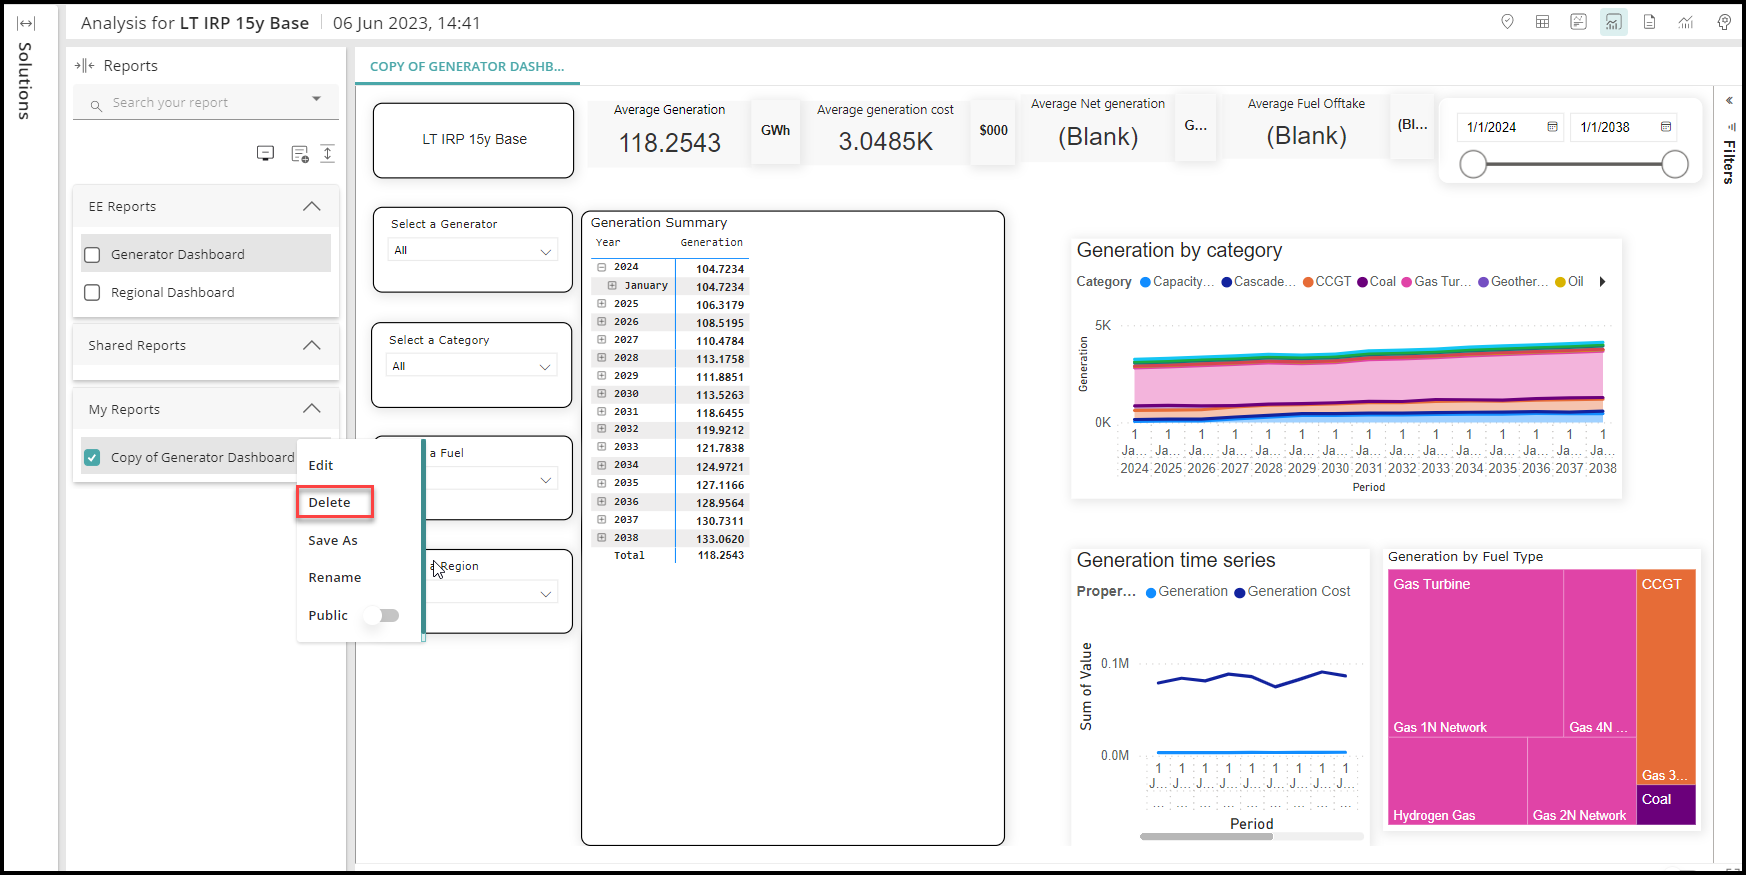
to confirm.
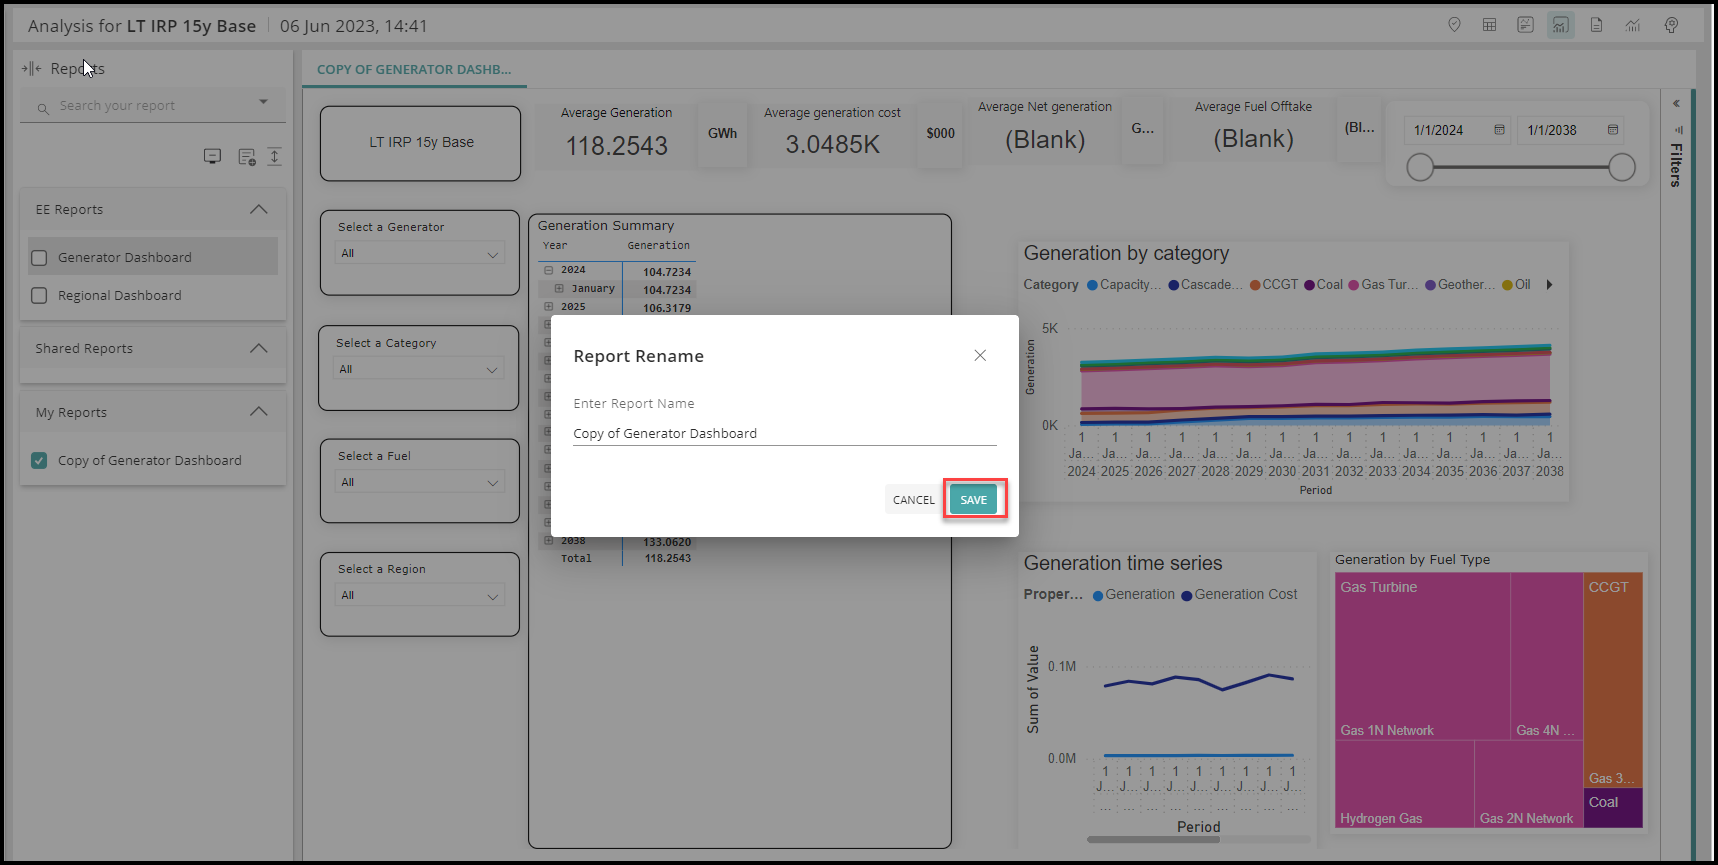
To rename a BI Report -

With the March release, we have introduced Shared Reports in addition to My Reports.
The Shared Reports lists only those BI Reports that your colleagues have shared with you or made public.
To make your BI Reports public, follow the below steps:
NOTE: All the users with a Modeler license can edit the report once it is made public. So be cautious editing other users’ reports and you may make a copy before you make the report public.
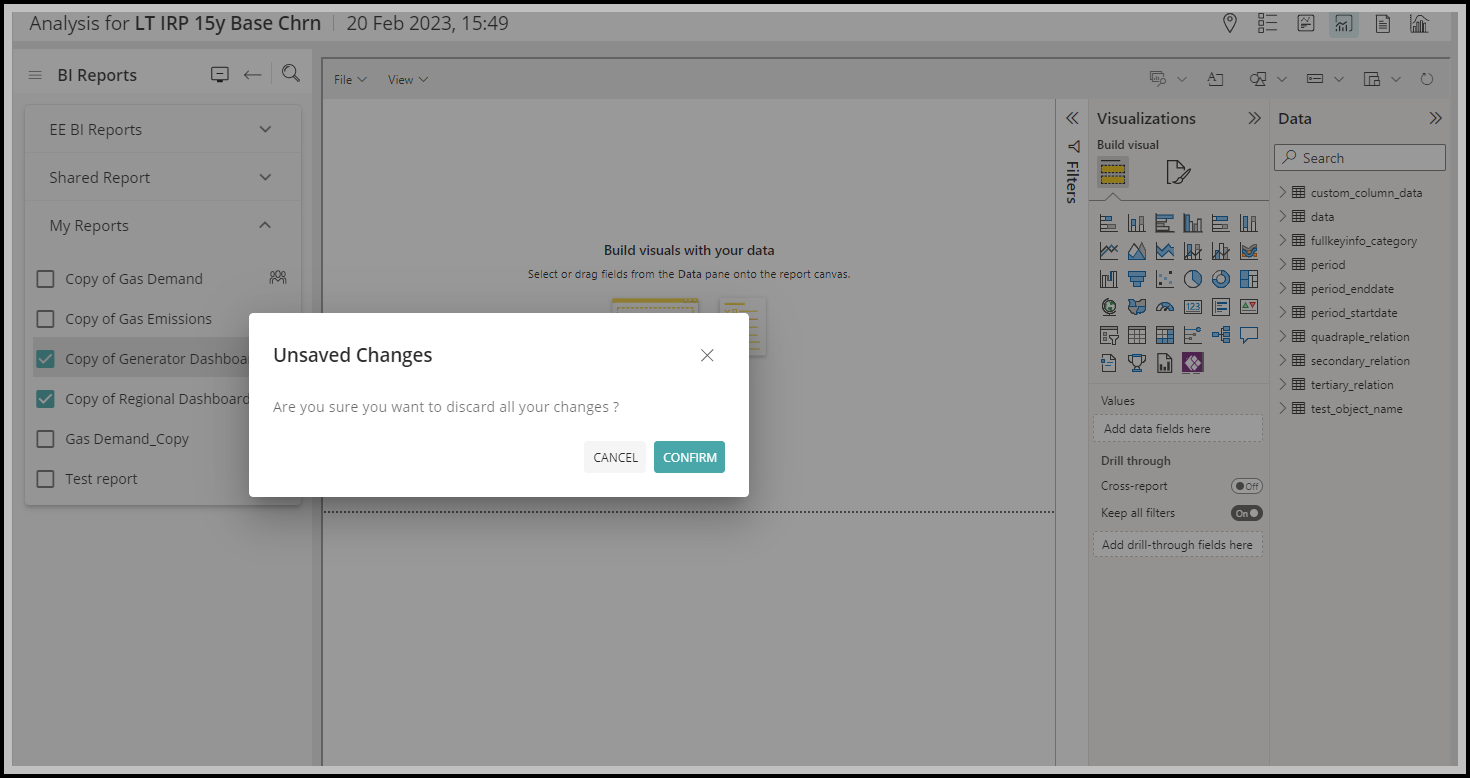
With this update, users are alerted when there are any unsaved changes in the BI Report.
When you are creating or editing a BI Report and exit the editor before saving your changes, you will be prompted to check and save your changes.
For example, follow the screenshots below.
The updated changes in the BI Reports are as follows:
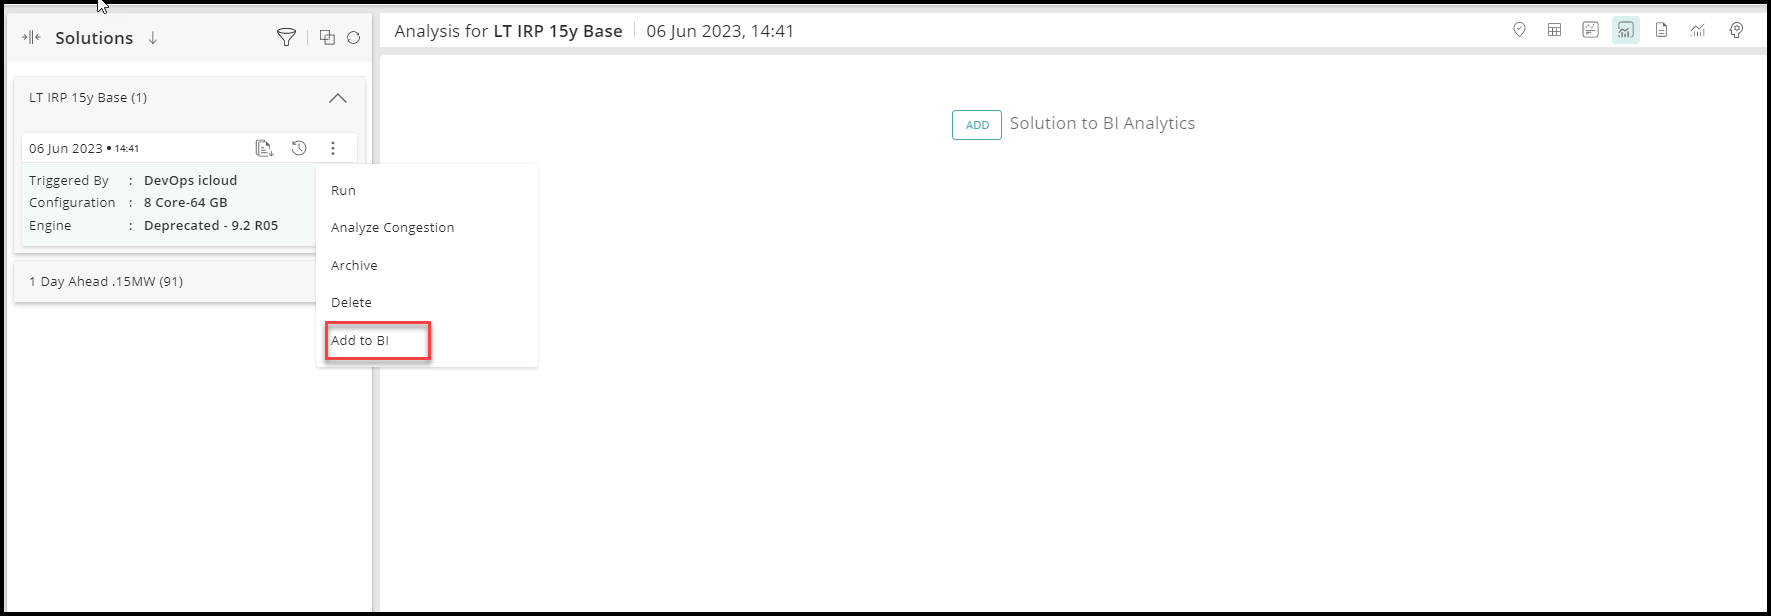
The option to support BI in Monte Carlo Solutions is now available for BI Reports. Users can now publish Monte Carlo Solutions to BI by selecting the “Publish to BI” option in the Solutions card.
NOTE: Please find the Schema definition doc in the attachment section (top right) of this article.
NOTE: Now, User level limits have been added for publishing BI Solutions. These limits will apply to all users of PLEXOS Cloud going forward. Each user will now have a maximum limit of 10 published Solutions. You will receive a warning message when you have exhausted your limit. To regain access to the limit, you'll need to unpublish some of your existing Solutions.
We believe that this update will help ensure that resources are used efficiently while still allowing you to create and publish the Solutions you need. If you have any questions or concerns about these changes, please don't hesitate to reach out to our support team for assistance.
Auto Save feature in BI Reports ensures periodic saving of BI Reports to reduce the risk of accidental data loss or overwriting data.
The default Auto Save interval is set to 10 minutes, automatically preserving your edits while in Edit mode.
To modify the default settings –
1. Click on the Username in the top right corner.
2. Navigate to Preferences and scroll down to BI Analytics Reports Settings.
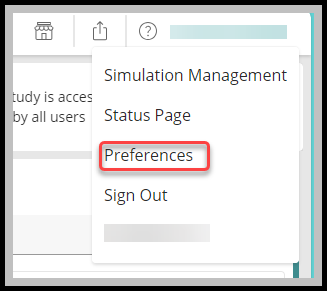
3. Select the preferred time limit under Auto Save Report.
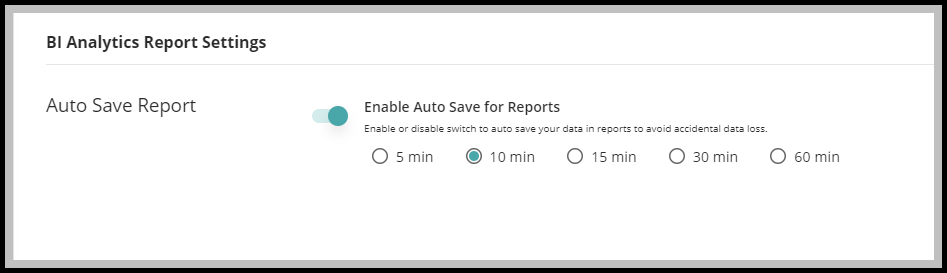
4. You also have the option to enable or disable the Auto Save feature based on your workflow preferences.
Bookmarks in BI Reports allow you to save common filters, sorting, and other settings in BI Reports while they are in View mode, making it easy for you to apply those settings when using the BI Reports.
This helps in returning to crucial insights quickly by saving specific views or states of a BI Report, instead of manually adjusting filters, sorting, or applying other settings each time.
All users having access to the BI Report, which includes saved Bookmarks for it, can utilize the Bookmark option.
To bookmark any Report, follow the steps below:
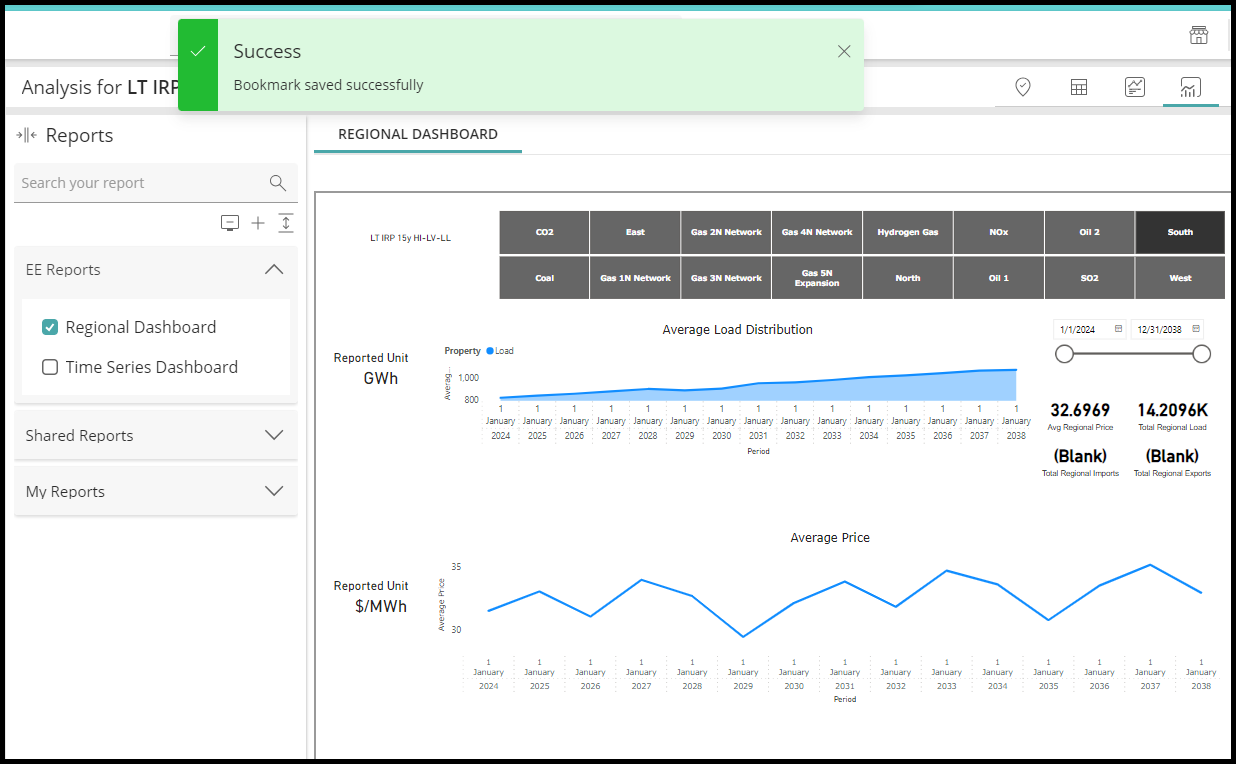
1. In View mode on a BI Report, once you have applied all the necessary filters or done with your settings, click on the Bookmark icon located on the far right.
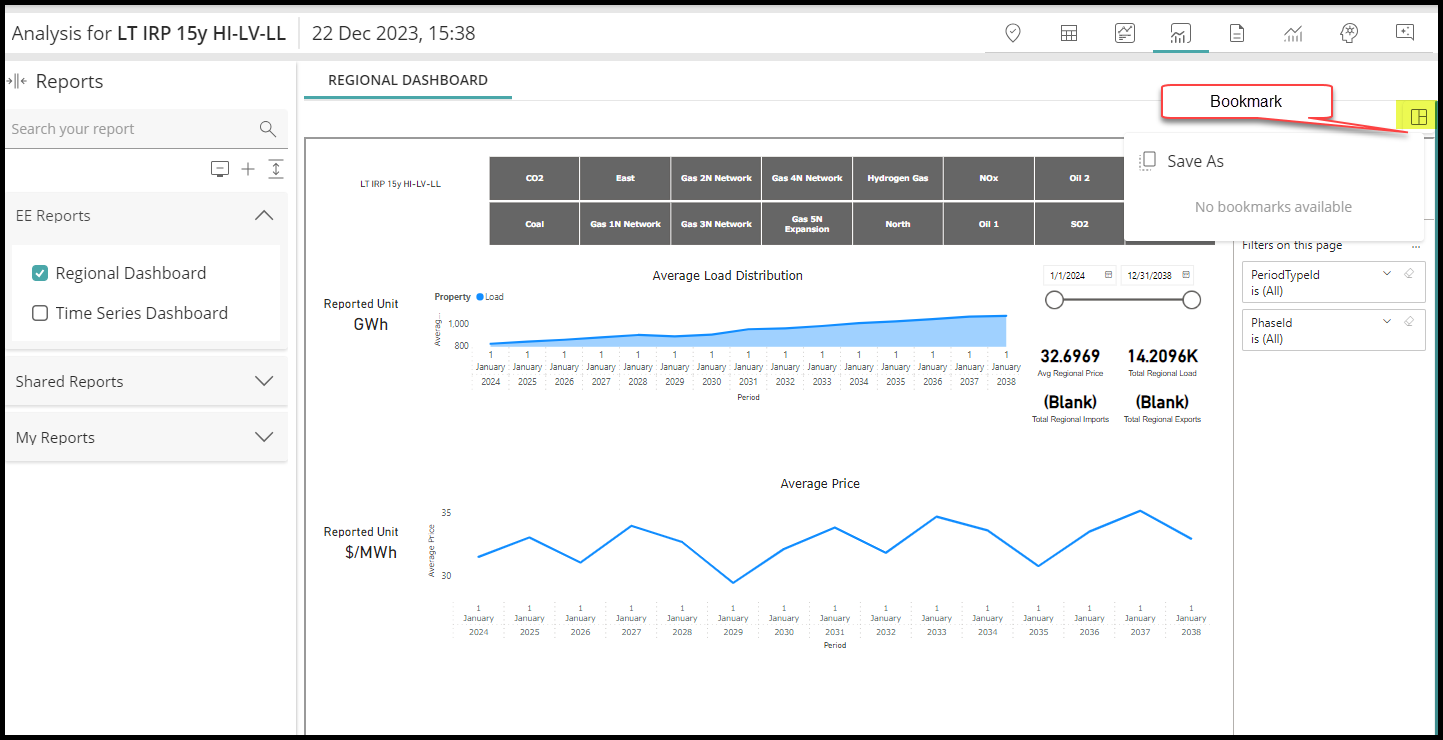
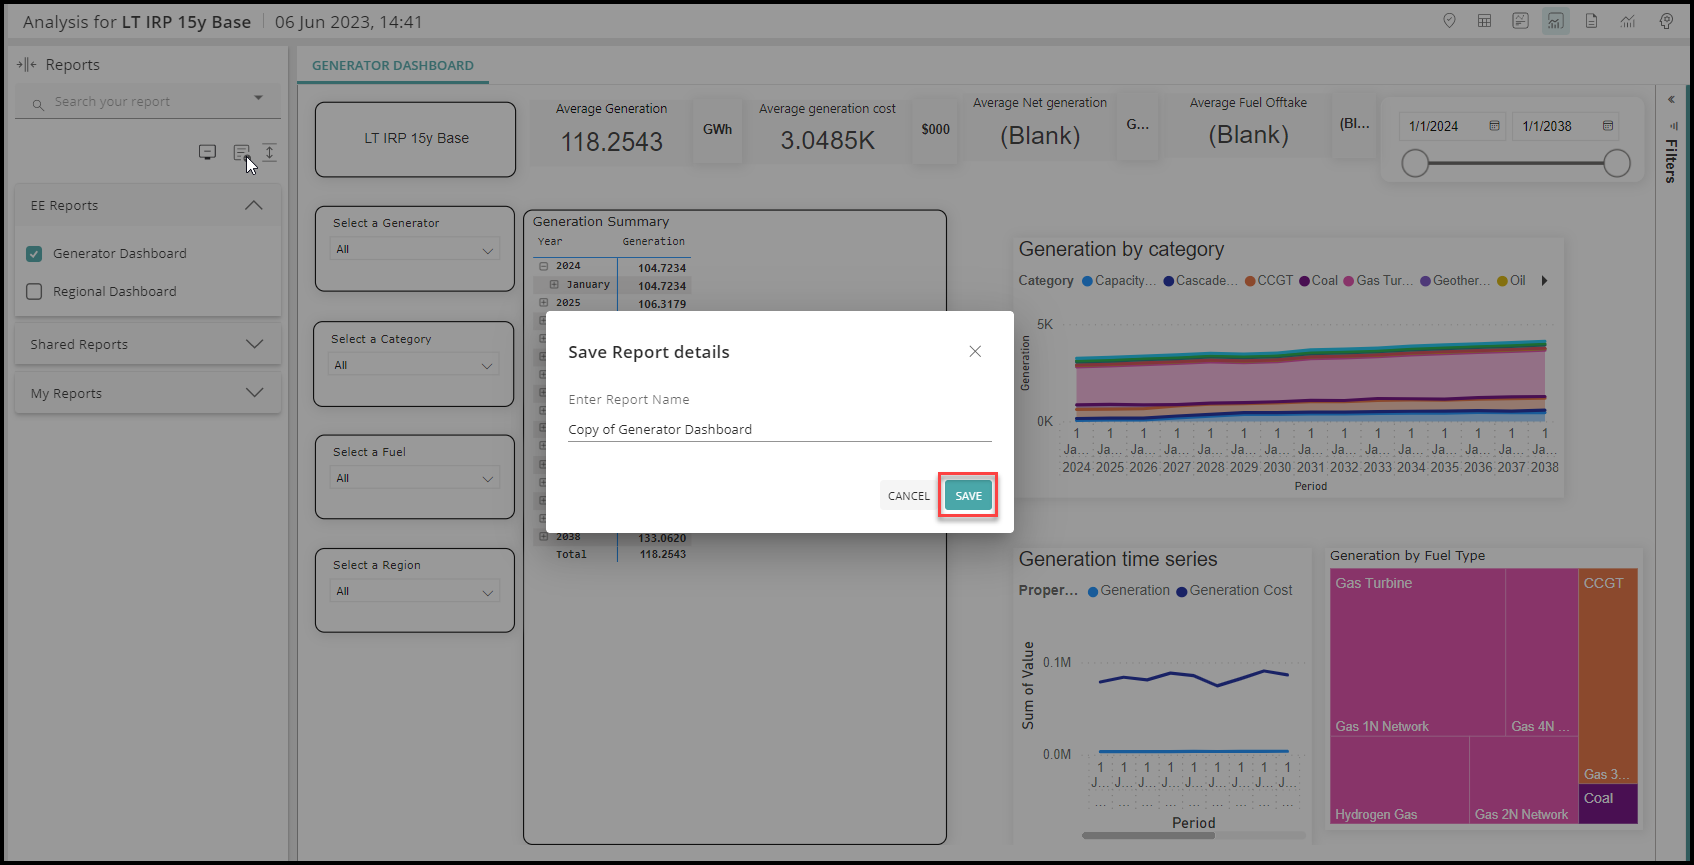
2. Click Save As.
3. Enter a name for the Bookmark and click SAVE.
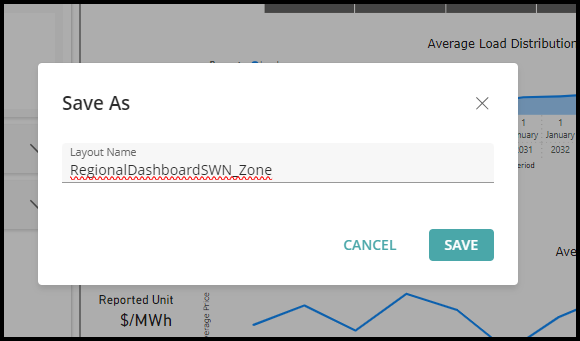
4. Your Bookmark will be saved successfully.
To apply the Bookmark next time, open the BI Reports, click the same icon and apply the saved bookmark as illustrated in the below GIF.
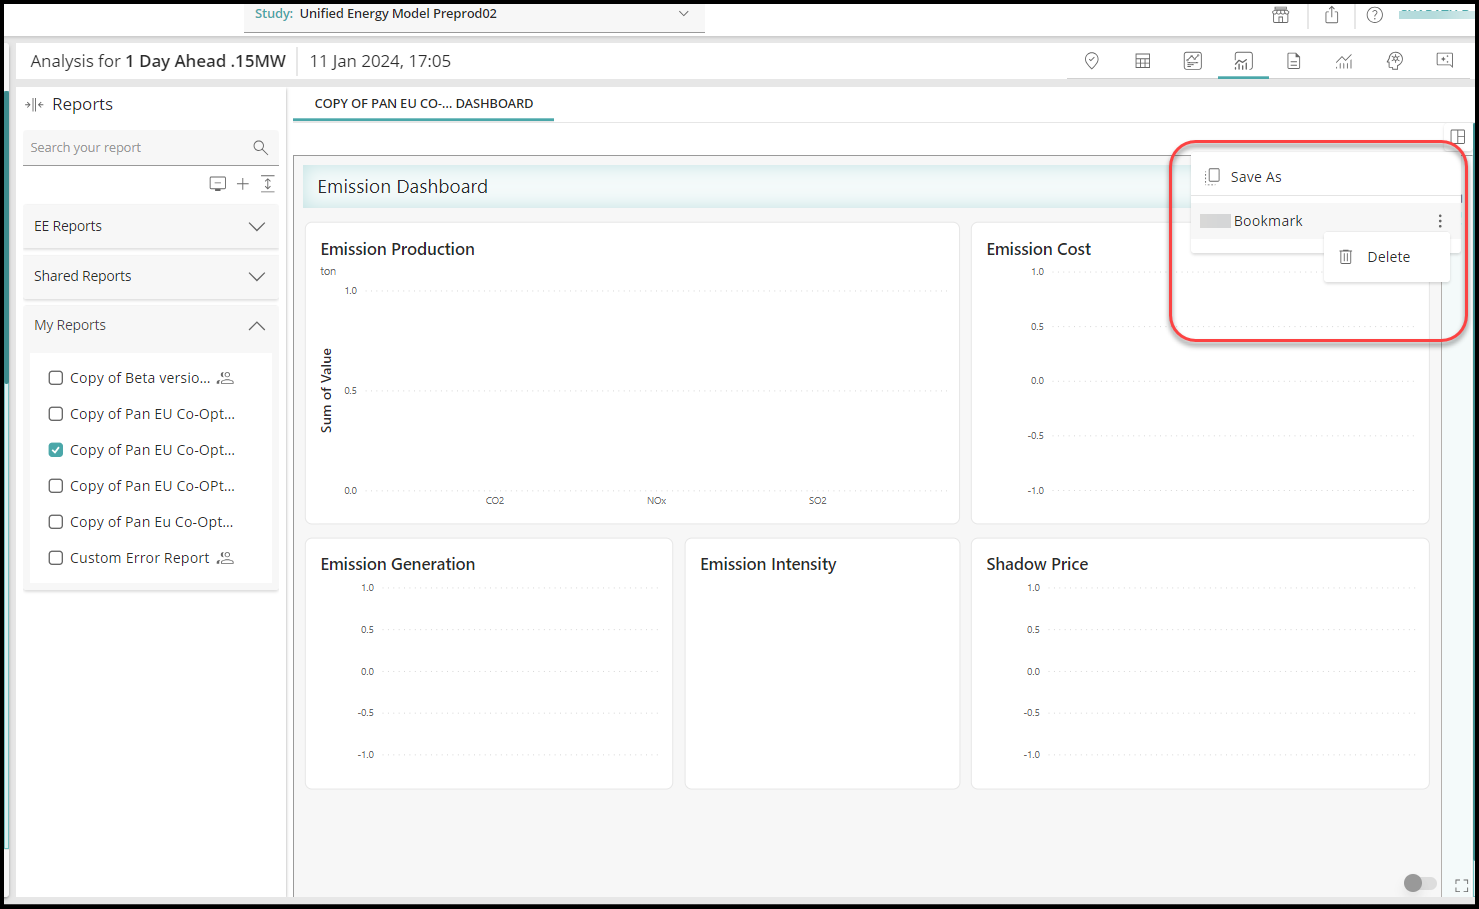
NOTE: Currently only Delete option is available in the Bookmark Action menu .
To delete a Bookmark -
a. Click on Bookmark icon.
b. Select the saved bookmark which you want to delete.
c. Click on the action menu of the selected Bookmark.
d. Click Delete
NOTE: Please find below PDF file for BI Reports Schema definition.