Integrated Resource Planning (IRP)
PLEXOS Cloud provides you with the first, out-of-the-box In-App report that is based on the configurable framework, Integrated Resource Planning report.
This report helps you understand the economics of the LT plan, Capacity position, and Energy position. It is designed to provide clarity in the summation of cost components, reduce post-processing, and streamline the IRP process.
Any LT plans can benefit from IRP. This report has been designed to address the pain points of post-processing to understand costs.
The detailed definition of the IRP report is as below:
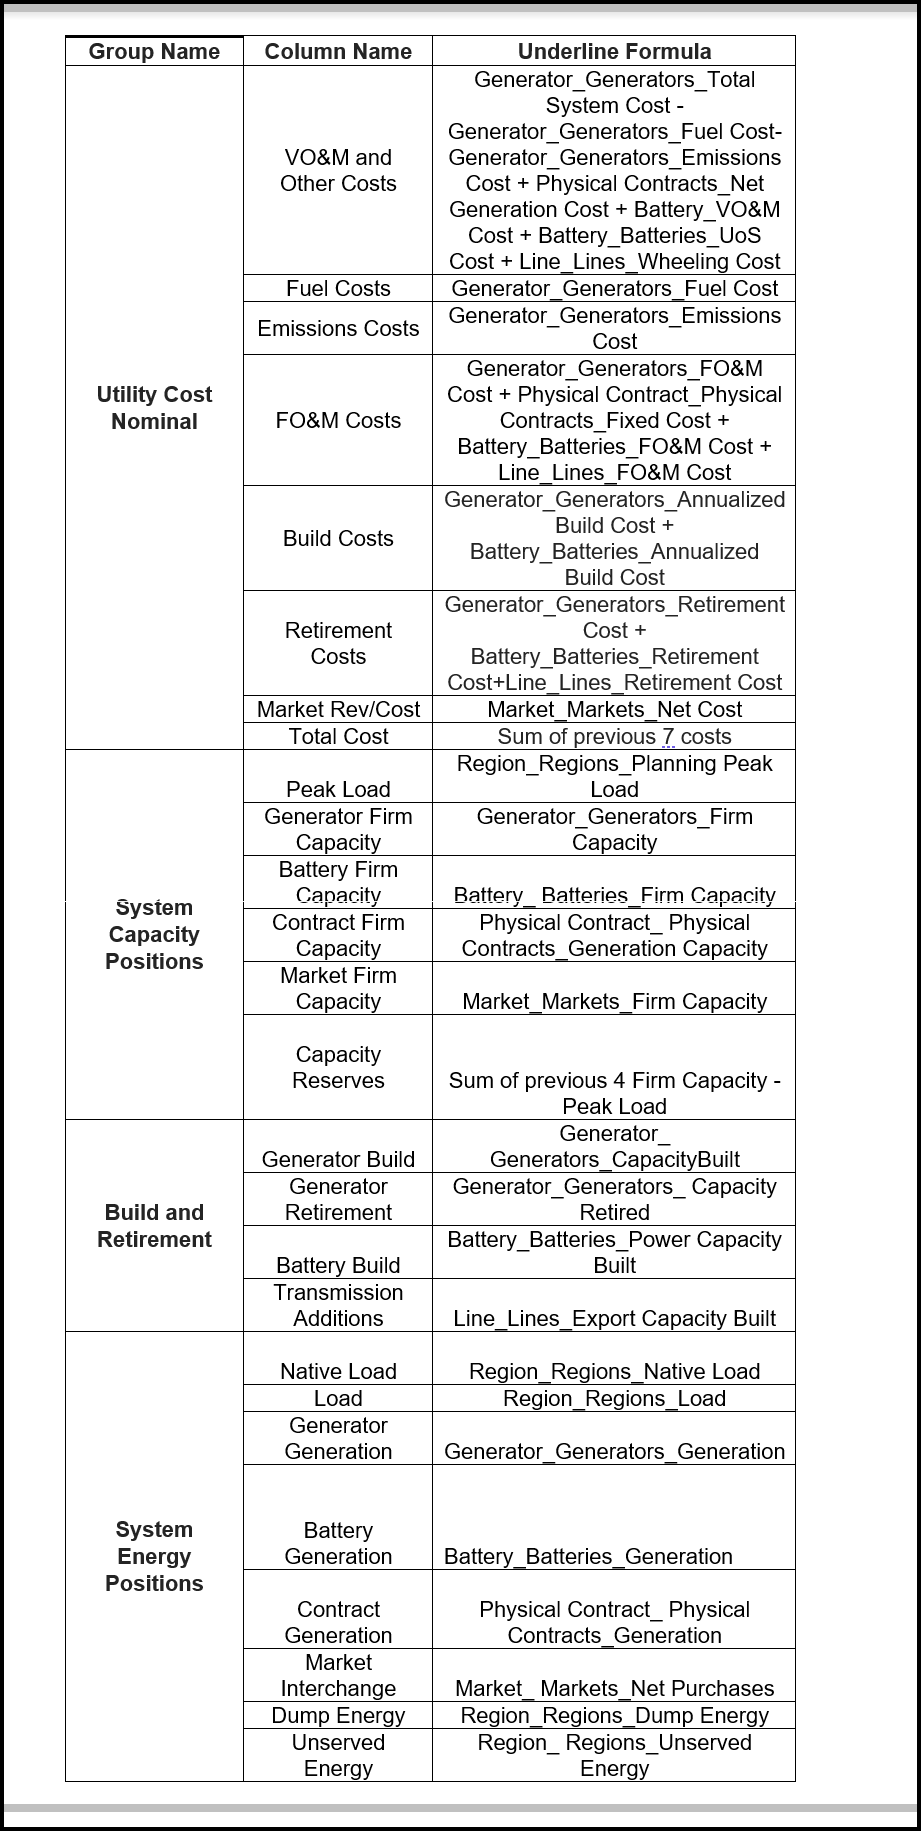
NOTE: These reports are not supported for Monte Carlo or Stochastic runs.
NOTE: The above-mentioned outputs in the IRP report table must be enabled in the Model on PLEXOS desktop prior to uploading the Study to PLEXOS Cloud and running the simulation. If the outputs are not enabled you will not get the correct values and total costs.
Refer the above shown 'IRP Report' table for the list of outputs that you need to enable.
How to check IRP report
To see the IRP report after a successful run:
1. Go to Solutions,
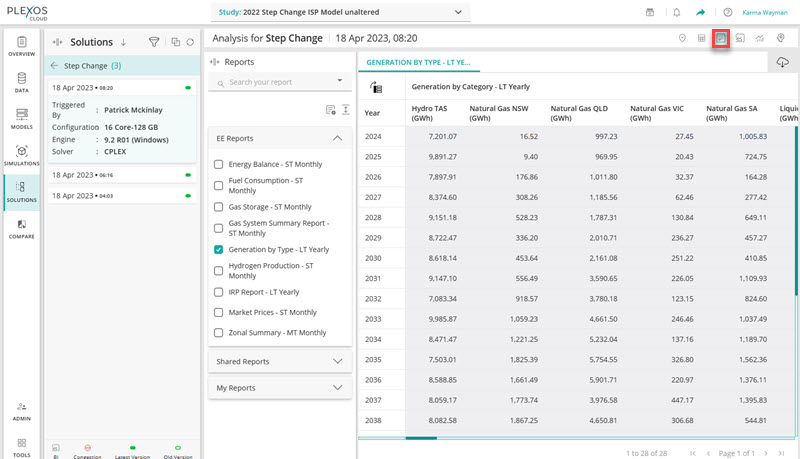
2. Click on the Report next to the Grid icon as shown in the screenshot below
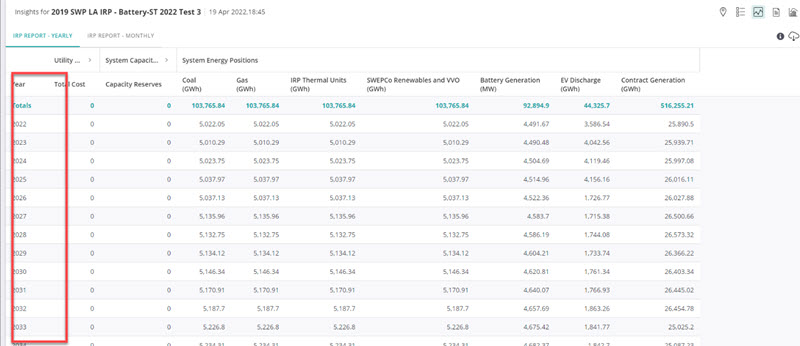
You will see the reports in two options ‘Yearly’ and ‘Monthly’
IRP Report – Yearly View
IRP Report – Monthly view
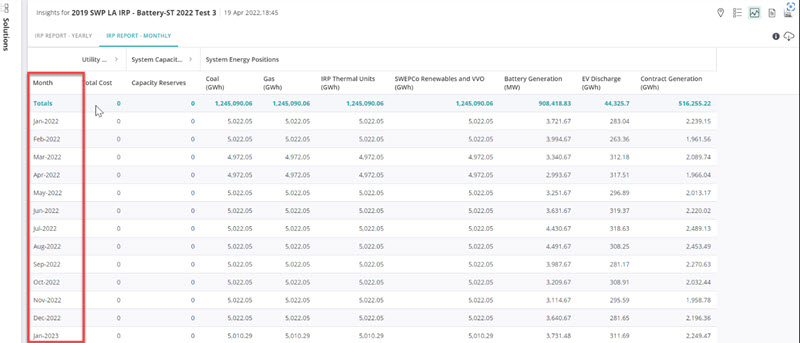
This report shows the value of utility cost for nominal value and real value, system capacity positions, Build and retirement, and System energy positions. It also calculates the total value of the run horizons.
Collapse and Expand Columns
If you want to check detailed components of the column, click on the ‘>’ arrow sign next to the column name, it will expand and show all the components behind that as shown in the images below, once you expand the ‘Utility Cost nominal’ it will show all the cost components of ‘Total Utility Costs’.
Click ‘<’ to collapse a column.
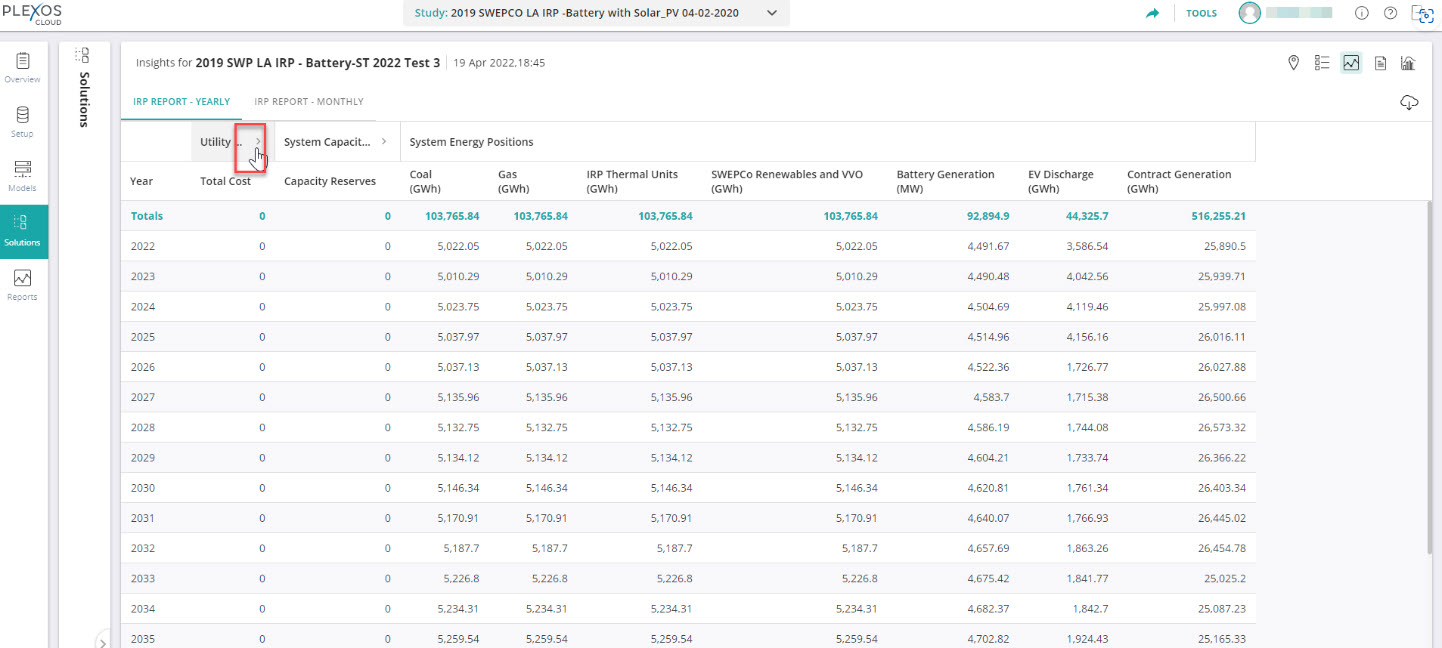
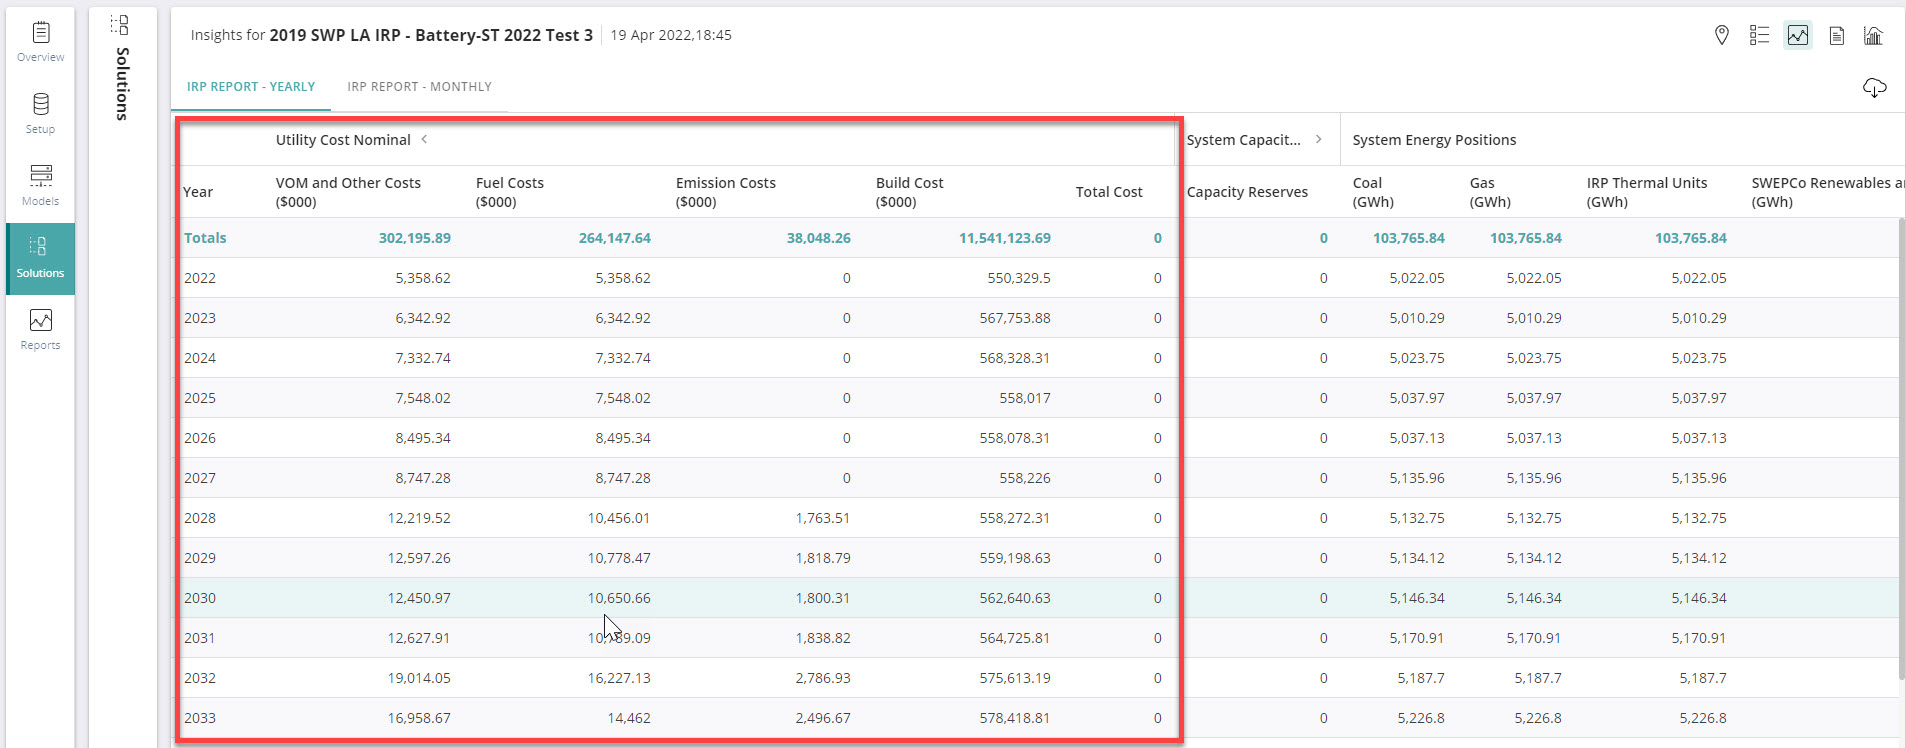
Likewise, you can also expand other columns like System Capacity Positions and Build & Retirement.
On hovering over the mouse of each component’s header, you can see the formula behind that column. Formulas such as a summation for a total cost will also be displayed.

Autosize Columns
To apply auto size on the columns, click on the Waffle (Horizontal bars) menu next to ‘Year’.
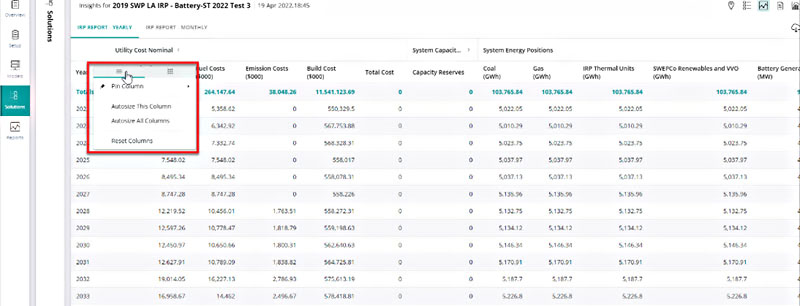
It will allow you to ‘Pin Column’, ‘Autosize This Column’, ‘Autosize All Columns’, and ‘Reset Columns’
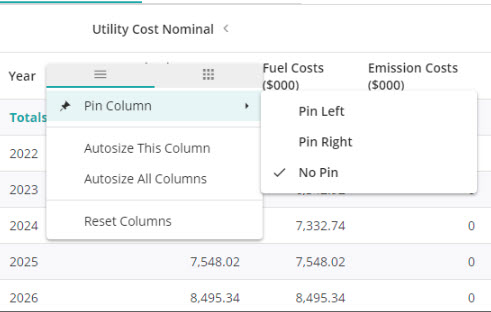
Sorting on 'Year'
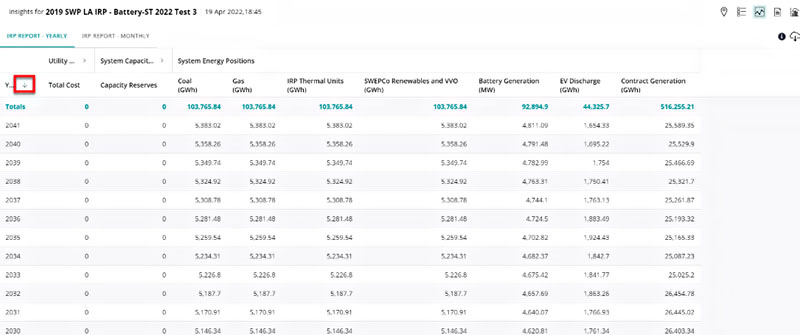
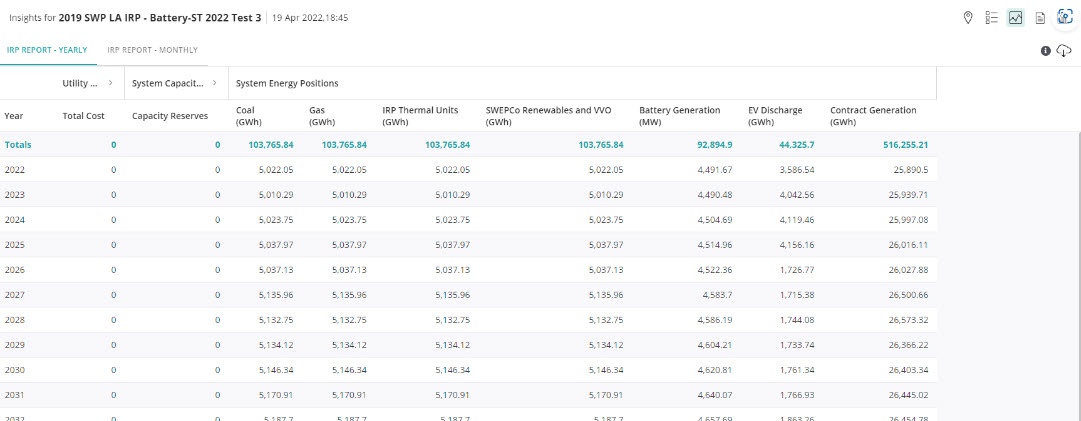
You can also do sorting on Year in ascending or descending order by clicking on the down arrow next to year as shown in the images below:
Download Report
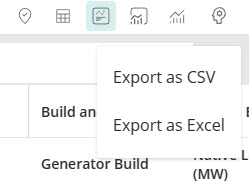
For comparison of plans and further analysis you can download the report by clicking on the download icon ( it will show two options – ‘Export as CSV’ or ‘Export as Excel’. Click on any of the two to get the report in the desired format.
Charting
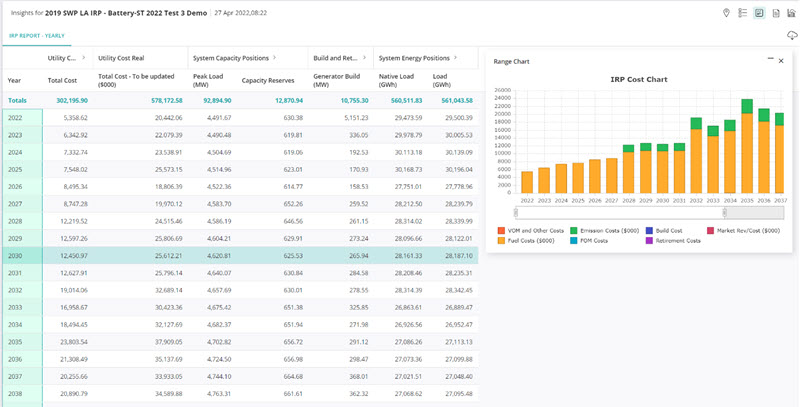
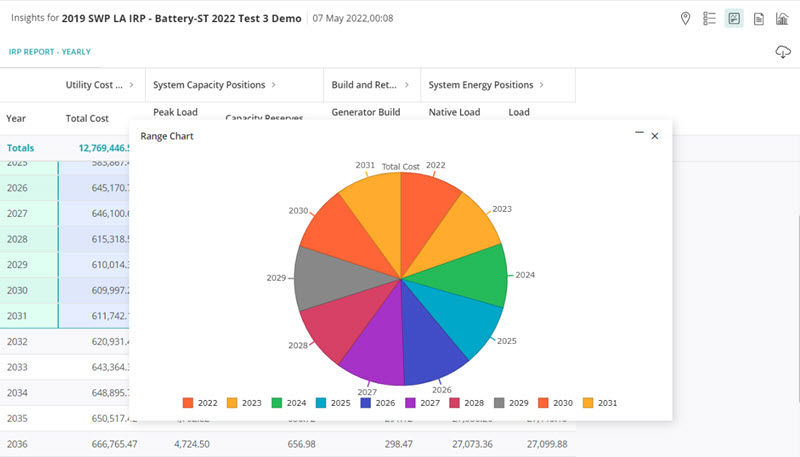
Charting is now enabled for IRP reports data. It is an out-of-the-box feature for AG grids.
To see the chart analysis of data, you need to manually select the required data fields and set chart type from the available options as shown in the below image.
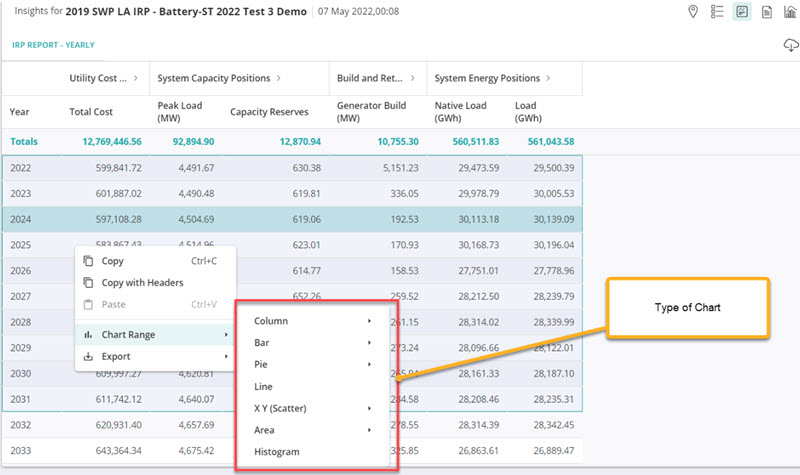
Once you click on the desired chart type, it will display the graph as shown below:
NOTE: Please find below PDF file for PLEXOS In-App Reporting Output list.
PLEXOS Output List for In AppReporting.pdf


