Citygate Pricing
Citygate pricing logic is used to calculate net delivery cost of gas at demand or storage injection node. This functionality can be divided in two parts:
- Delivered Price Calculation
- Gas Tracking
Both these calculations are done post optimization based on user output property selections.
Delivered Price Calculation
Delivered prices for each gas node are calculated by solving a system of linear equations A x = bAx=b, where square matrix AA represents node flows and vector bb represents node injection costs. The delivered price calculated by solving this system of equations represents the injection weighted average of the injection cost of each gas source at the node as shown below.
\begin{equation} \text{Delivered Price} = \frac{\sum_{\text{Source}}(\text{Inj} \times \text{Price})}{\sum_{\text{Source}} \text{Inj}} \end{equation}Please note that this algorithm does not pair supply with demand and no priority-based allocations are performed. This is inline with portfolio optimization performed prior to this step where explicit pairing of supply and demand is not done. This algorithm is very fast since it only requires solution to a system of linear equations. Delivered price is influenced by price of initial inventory in a gas storage. Please refer to input property Initial Inventory Price for more details. Delivered price and cost of delivering the gas to a given node is available in the solution outputs at the Gas Node level. Please refer to the output properties below.
Delivered price is also used in calculating initial and ending Gas Storage inventory values. The initial storage inventory price is used to price any gas already available in the gas storage at the beginning of run. Any subsequent injections increase the inventory value by injected volume multiplied by delivered price in the current period. Any withdrawals decrease the inventory value by withdrawal volume multiplied by delivered price in the previous period. Please note that any withdrawals are priced at delivered price in previous period because delivered price is not known at the time withdrawal were made and value of withdrawals is important to determine delivered price for the current period. Please refer to the following output properties for getting initial and ending inventory values for a Gas Storage.Gas Tracking
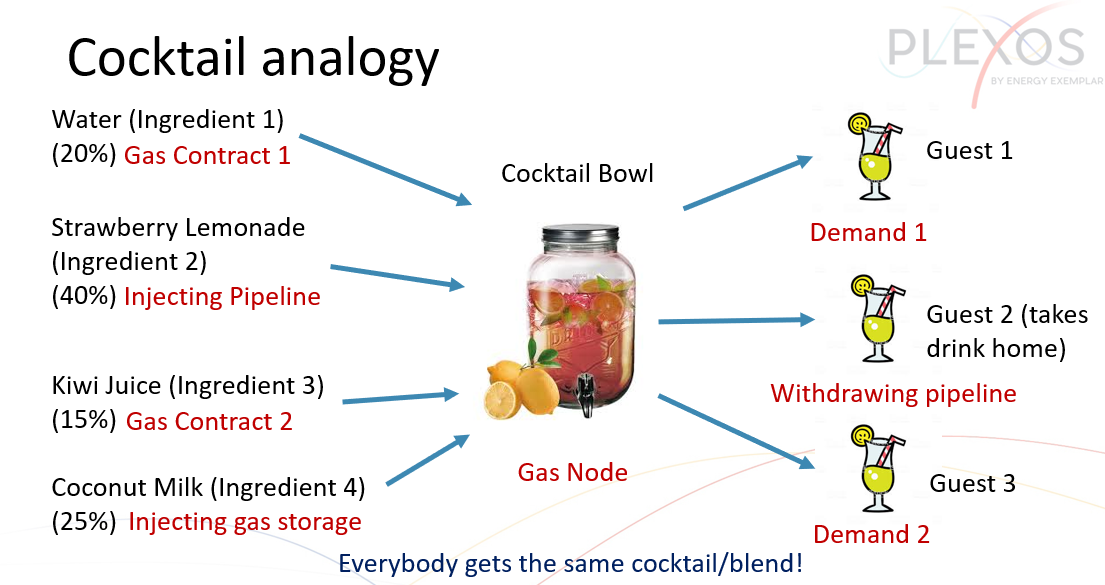
Gas Tracking is the idea of assigning every single molecule of gas coming from supply to demand. Gas Tracking can also be used to calculate delivered price at a gas node. However, it is modeled as a separate module in PLEXOS since calculations are more complex and need not be performed if detailed allocations are not desired.
To understand how PLEXOS tracks gas, the cocktail analogy is useful. As shown in the picture below, gas from various gas sources is mixed in uniformly. This blend is split among gas demands in the ratio of respective demands. For example, in the picture below, each demand is of the same amount. Hence, each demand takes 1/3rd of each gas source.
The quantity delivered for each Gas Demand is available by gas source. Please refer to the output properties below.
- Delivered Quantity for Gas Demand by Gas Storages
- Delivered Quantity for Gas Demand by Gas Fields
- Delivered Quantity for Gas Demand by Gas Contracts
- Delivered Quantity for Gas Storage by other Gas Storages
- Delivered Quantity for Gas Storage by Gas Fields
- Delivered Quantity for Gas Storage by Gas Contracts
Example
The following is a simple gas network with 3 nodes. Gas sources S1, S2, S3 and S4, and Demand D1, D2, and D3 is shown below. All flows are known since optimization has already been performed.
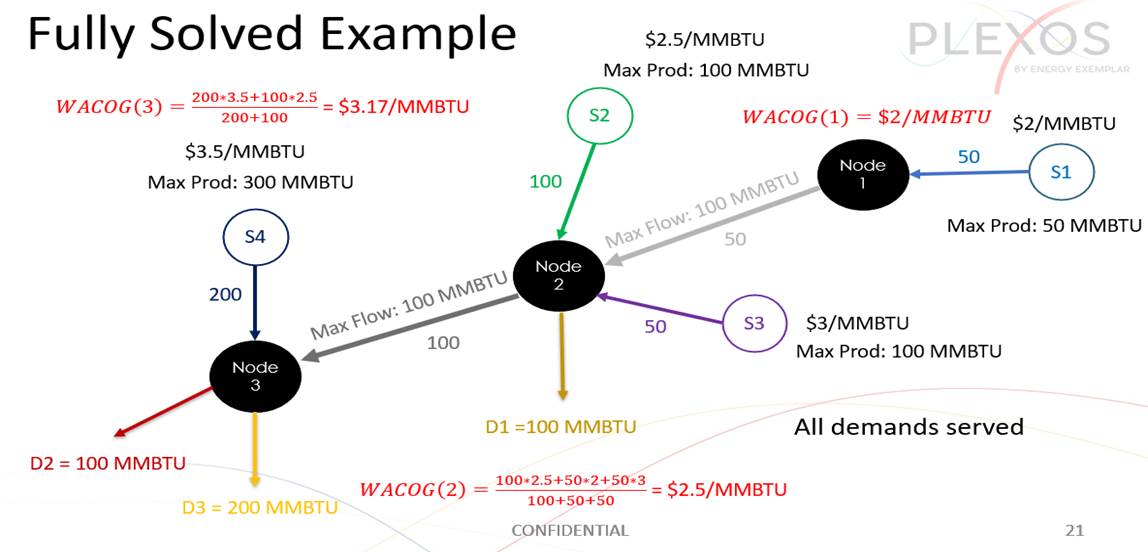
Weighed Average Cost of 1 unit of gas at Node 1 is $2/MMBTU since gas source S1 is the only supplier of gas available at this node. However, at Node 2, gas is mixed in from 3 different sources, namely S1, S2 and S3. The respective injection amounts are 50, 100 and 50. Hence, injection weighted average price of one unit of gas at Node 2 is:
\begin{equation} \text{Delivered Price at Node 2} = \frac{(50 \times 2) + (100 \times 25) + (50 \times 3)}{50 + 100 + 50} \end{equation}The incoming gas blend at Node 2 is split equally between demand D1 and pipeline flowing from Node 2 to Node 3. Hence, the blend gets split equally among two. Please note that column totals in the table below equal the respective takes from the gas source.
| Entity | S1 | S2 | S3 |
|---|---|---|---|
| D1 | 25 | 50 | 25 |
| Pipeline (Node2->Node3) | 25 | 50 | 25 |
| Total | 50 | 100 | 50 |