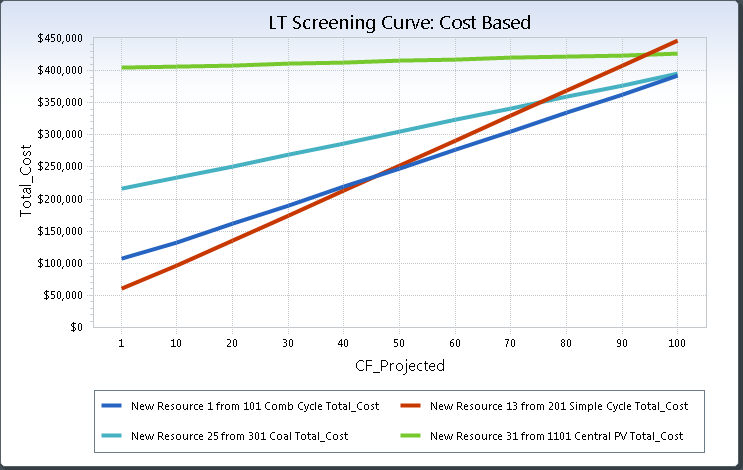
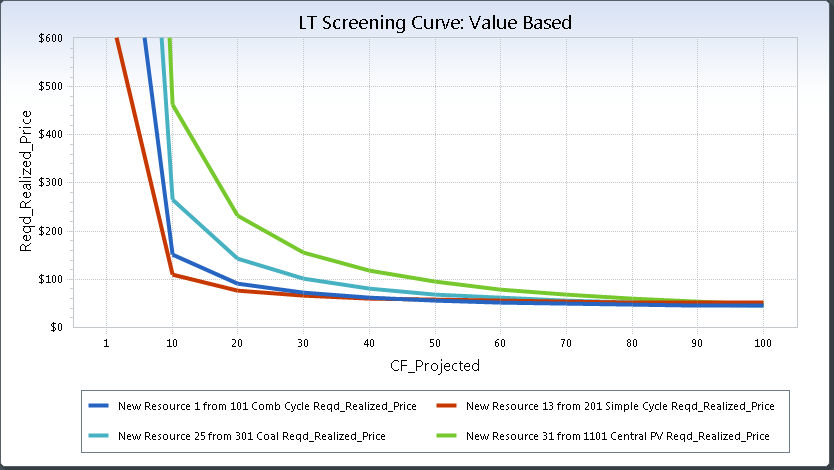
LTScreeningCurve Output Table

The LT Screening Curve output table is used to determine economic viability of new and existing resources relative to other resource options.

COLUMNS INCLUDE

Capacity_Factor

CF_Projected

Fixed_Cost

ID

LT_Iteration

Name

Net_Output_Factor

Pool

Record_Number

Reqd_Contribution_To_Margin

Reqd_Realized_Price

Run_ID

Study_Info

Total_Cost

Variable_Cost

Year

Zone

Example Charts

 Output Tables

 LTScreeningCurve Output Table


For further assistance, please contact Aurora Support.

Copyright© 1997-2022 Energy Exemplar LLC. All rights reserved.