Transmission - Economic Dispatch
With the flows in the network being calculated based on the precomputed shift factors, we can now compute an economic dispatch and optimal power flow i.e. the output levels of all plants that minimises total production cost and respects thermal limits of the transmission lines in the network.
The economic dispatch and optimal power flow for the 7-Node system is shown in Figure 1. PLEXOS reports the data on the lines in the system as in Table 1. Lines "2_5" and "4_5" are flowing at their thermal limits. There is a shadow price associated with the "2_5" limit. Table 2 shows the solution data for nodes. Note how the prices at each node are different: this is an example of nodal pricing (or locational marginal pricing) and is caused by the congestion on Line "2_5".
Table 1: Line Solution Data
| Line | Max Rating (MW) | Min Rating (MW) | Flow (MW) | Loss (MW) | Marginal Loss (%) | Marginal Loss Factor | Is Congested (Yes/No) [1] | Shadow Price ($/MW) |
|---|---|---|---|---|---|---|---|---|
| 1_2 | 120 | -120 | 4.62 | 0 | 0 | 1 | 0 | 0 |
| 1_3 | 120 | -120 | 15.38 | 0 | 0 | 1 | 0 | 0 |
| 1_2 | 120 | -120 | 4.62 | 0 | 0 | 1 | 0 | 0 |
| 2_3 | 100 | -100 | 19.23 | 0 | 0 | 1 | 0 | 0 |
| 2_4 | 100 | -100 | 0 | 0 | 0 | 1 | 0 | 0 |
| 2_5 | 120 | -120 | 120 | 0 | 0 | 1 | -1 | 10.53 |
| 2_6 | 200 | -200 | 130 | 0 | 0 | 1 | 0 | 0 |
| 3_4 | 222 | -222 | -115.38 | 0 | 0 | 1 | 0 | 0 |
| 4_5 | 60 | -60 | 60 | 0 | 0 | 1 | -1 | 0 |
| 5_7 | 200 | -200 | 50 | 0 | 0 | 1 | 0 | 0 |
| 6_7_1 | 200 | -200 | 40 | 0 | 0 | 1 | 0 | 0 |
| 6_7_2 | 200 | -200 | 40 | 0 | 0 | 1 | 0 | 0 |
Table 2: Node Solution Data
| Child Name | Phase Angle (degrees) | Load (MW) | Generation (MW) | Price ($/MWh |
|---|---|---|---|---|
| 1 | 0 | 0 | 20 | 14.95 |
| 2 | 0.13 | 40 | 304.62 | 15 |
| 3 | 2.12 | 150 | 0 | 14.69 |
| 4 | 0.13 | 80 | 255.38 | 14.6 |
| 5 | 8.38 | 130 | 0 | 22.42 |
| 6 | 4.6 | 200 | 150 | 16.86 |
| 7 | 10.1 | 200 | 70 | 20.57 |
*Note that as a convention PLEXOS uses 0 for "No" and -1 for "Yes" in reporting Boolean type values.
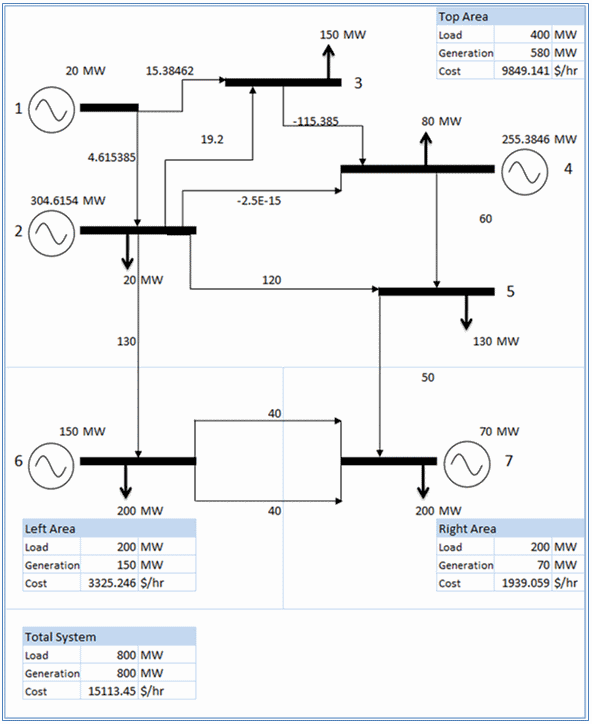 Figure 1: 7-Node Economic Dispatch