Transmission - Example
Contents
1. Introduction
This section lists the complete data for the 7-node case referred to throughout this paper. The dataset is available for download from Energy Exemplar along with the network diagram in Excel format.
2. Network Diagram
Figure 7 illustrates the 7-Node network and its optimal power flow for the dispatch given in Table 15. Note that this is not the economic dispatch, simply an example dispatch for the purposes of validating the optimal power flow. A 'hardwired' dispatch like this can be entered into PLEXOS using the Generator Fixed Load property.
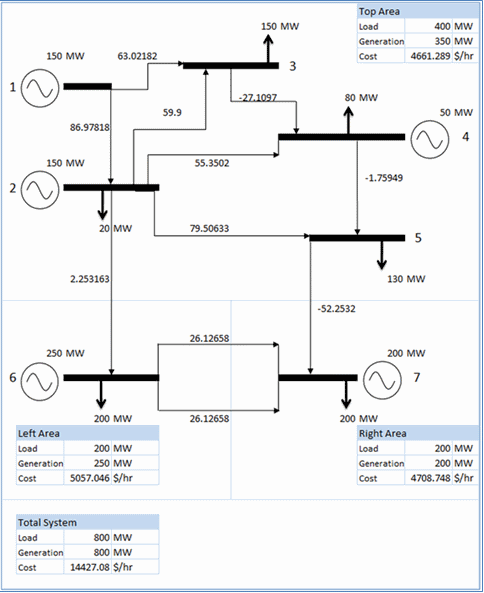 Figure 7:7-Node Network
3. Input Data
The following tables list the data for the 7-Node system.
Table 11: Node Data
| Node | Region | Load Participation Factor |
|---|---|---|
| 1 | Top Area | 0 |
| 2 | Top Area | 0.1 |
| 3 | Top Area | 0.375 |
| 4 | Top Area | 0.2 |
| 5 | Top Area | 0.325 |
| 6 | Left Area | 1 |
| 7 | Right Area | 1 |
Table 12: Region Data
| Region | Load |
|---|---|
| Left Area | 200 |
| Right Area | 200 |
| Top Area | 400 |
Table 13: Line Data
| Line | Node From | Node To | Max Flow | Min FLow | Resistance | Reactance |
|---|---|---|---|---|---|---|
| 1-2 | 1 | 2 | 120 | -120 | 0.005 | 0.05 |
| 1-3 | 1 | 3 | 120 | -120 | 0.02 | 0.24 |
| 2-3 | 2 | 3 | 100 | -100 | 0.015 | 0.18 |
| 2-4 | 2 | 4 | 100 | -100 | 0.015 | 0.18 |
| 2-5 | 2 | 5 | 120 | -120 | 0.01 | 0.12 |
| 2-6 | 2 | 6 | 200 | -200 | 0.005 | 0.06 |
| 3-4 | 3 | 4 | 222 | -222 | 0.0025 | 0.03 |
| 4-5 | 4 | 5 | 60 | -60 | 0.02 | 0.24 |
| 5-6 | 5 | 7 | 200 | -200 | 0.005 | 0.06 |
| 6-7 | 6 | 7 | 200 | -200 | 0.02 | 0.24 |
Table 14: Generator Capacity Data
| Generator | Units | Max Capacity | Fuel Price | Min Stable Level | Commit |
|---|---|---|---|---|---|
| 1 | 1 | 400 | 1 | 0 | 1 |
| 2 | 1 | 500 | 1 | 150 | 1 |
| 4 | 1 | 300 | 2.09 | 50 | 1 |
| 6 | 1 | 500 | 2.14 | 150 | 1 |
| 7 | 1 | 600 | 2.57 | 0 | 1 |
Table 15: Generator Dispatch
| Generator | Fixed Load |
|---|---|
| 1 | 150 |
| 2 | 150 |
| 4 | 50 |
| 6 | 250 |
| 7 | 200 |
Table 16: Generator Heat Rate Data
| Generator | Load Point | Heat Rate Base | Band | Heat Rate Incr |
|---|---|---|---|---|
| 1 | 10 | 373.5 | 1 | 12 |
| 1 | 20 | - | 2 | 12.5 |
| 1 | 30 | - | 3 | 13 |
| 2 | - | 403.6 | 1 | 15 |
| 4 | - | 253.2 | 1 | 6.698564593 |
| 6 | 20 | 388.9 | 1 | 7.593457944 |
| 6 | 40 | - | 2 | 7.64953271 |
| 6 | 60 | - | 3 | 7.700934579 |
| 6 | 80 | - | 4 | 7.752336449 |
| 6 | 100 | - | 5 | 7.803738318 |
| 6 | 120 | - | 6 | 7.855140187 |
| 6 | 140 | - | 7 | 7.911214953 |
| 6 | 160 | - | 8 | 7.962616822 |
| 6 | 180 | - | 9 | 8.014018692 |
| 6 | 200 | - | 10 | 8.065420561 |
| 6 | 220 | - | 11 | 8.11682243 |
| 6 | 240 | - | 12 | 8.172897196 |
| 6 | 260 | - | 13 | 8.224299065 |
| 6 | 280 | - | 14 | 8.275700935 |
| 6 | 300 | - | 15 | 8.327102804 |
| 6 | 320 | - | 16 | 8.378504673 |
| 6 | 340 | - | 17 | 8.434579439 |
| 6 | 360 | - | 18 | 8.485981308 |
| 6 | 380 | - | 19 | 8.537383178 |
| 6 | 400 | - | 20 | 8.588785047 |
| 7 | 120 | 194.28 | 1 | 8.003108003 |
| 7 | 240 | - | 2 | 8.469308936 |
| 7 | 360 | - | 3 | 8.935508936 |
| 7 | 480 | - | 4 | 9.401709402 |
| 7 | 600 | - | 5 | 9.867909868 |
4. Shift Factors
Table 17 shows the shift factors computed for the 7-Node case assuming Node "1" is the slack bus. Table 18 shows the shift factors for the distributed load slack case.
Table 17: Shift Factors for 7-Node System (single slack bus)
| Injection Point | 0 | 1 | 2 | 3 | 4 | 5 | 6 | |
|---|---|---|---|---|---|---|---|---|
| Bus From | Bus To | 1 | 2 | 3 | 4 | 5 | 6 | 7 |
| 1 | 2 | 0 | -0.865 | -0.648 | -0.69284 | -0.82196 | -0.85424 | -0.83272 |
| 1 | 3 | 0 | -0.135 | -0.352 | -0.30716 | -0.17804 | -0.14576 | -0.16728 |
| 2 | 3 | 0 | 0.060277 | -0.28933 | -0.2171 | -0.00907 | 0.042941 | 0.008269 |
| 2 | 4 | 0 | 0.047823 | -0.22955 | -0.30447 | -0.04025 | 0.025805 | -0.01823 |
| 2 | 5 | 0 | 0.017934 | -0.08608 | -0.11418 | -0.51509 | -0.11532 | -0.38184 |
| 2 | 6 | 0 | 0.008967 | -0.04304 | -0.05709 | -0.25755 | -0.80766 | -0.44092 |
| 3 | 4 | 0 | -0.07472 | 0.358673 | -0.52426 | -0.18711 | -0.10282 | -0.15901 |
| 4 | 5 | 0 | -0.0269 | 0.129122 | 0.171266 | -0.22736 | -0.07702 | -0.17724 |
| 5 | 7 | 0 | -0.00897 | 0.043041 | 0.057089 | 0.257547 | -0.19234 | -0.55908 |
| 6 | 7 | 0 | 0.008967 | -0.04304 | -0.05709 | -0.25755 | 0.192338 | -0.44092 |
Table 18: Shift Factors for 7-Node System (distributed load slack)
| Injection Point | 0 | 1 | 2 | 3 | 4 | 5 | 6 | |
|---|---|---|---|---|---|---|---|---|
| Bus From | Bus To | 1 | 2 | 3 | 4 | 5 | 6 | 7 |
| 1 | 2 | 0.8073877 | -0.05761184 | 0.1593853 | 0.1145512 | -0.01457109 | -0.04685165 | -0.02533127 |
| 1 | 3 | 0.1926123 | 0.05761184 | -0.1593853 | -0.1145512 | 0.01457109 | 0.04685165 | 0.02533127 |
| 2 | 3 | 0.03254209 | 0.09281907 | -0.2567874 | -0.1845546 | 0.02347564 | 0.07548321 | 0.0408115 |
| 2 | 4 | 0.0492345 | 0.09705755 | -0.1803162 | -0.2552389 | 0.008983428 | 0.07503902 | 0.03100196 |
| 2 | 5 | 0.2392963 | 0.2572299 | 0.1532148 | 0.1251187 | -0.2757979 | 0.123973 | -0.1425409 |
| 2 | 6 | 0.4529815 | 0.4619483 | 0.4099407 | 0.3958927 | 0.1954344 | -0.3546802 | 0.01206287 |
| 3 | 4 | 0.1001544 | 0.02543091 | 0.4588273 | -0.4241058 | -0.08695327 | -0.00266514 | -0.05885723 |
| 4 | 5 | 0.08272226 | 0.05582179 | 0.2118445 | 0.2539886 | -0.1446365 | 0.005707217 | -0.09452194 |
| 5 | 7 | 0.2136852 | 0.2047184 | 0.2567259 | 0.270774 | 0.4712323 | 0.02134685 | -0.3453962 |
| 6 | 7 | 0.1196481 | 0.128615 | 0.07660739 | 0.06255936 | -0.1378989 | 0.3119865 | -0.3212705 |