PLEXOS User Interface Guide Chapter 14
Contents
1. Diagnostic Scenario Tree Files
Diagnostic scenario tree files may be output by a simulation and will be located in the Solution folder. These can be loaded into PLEXOS for auditing.
The entire tree will show all possibilities that PLEXOS determined during simulation.
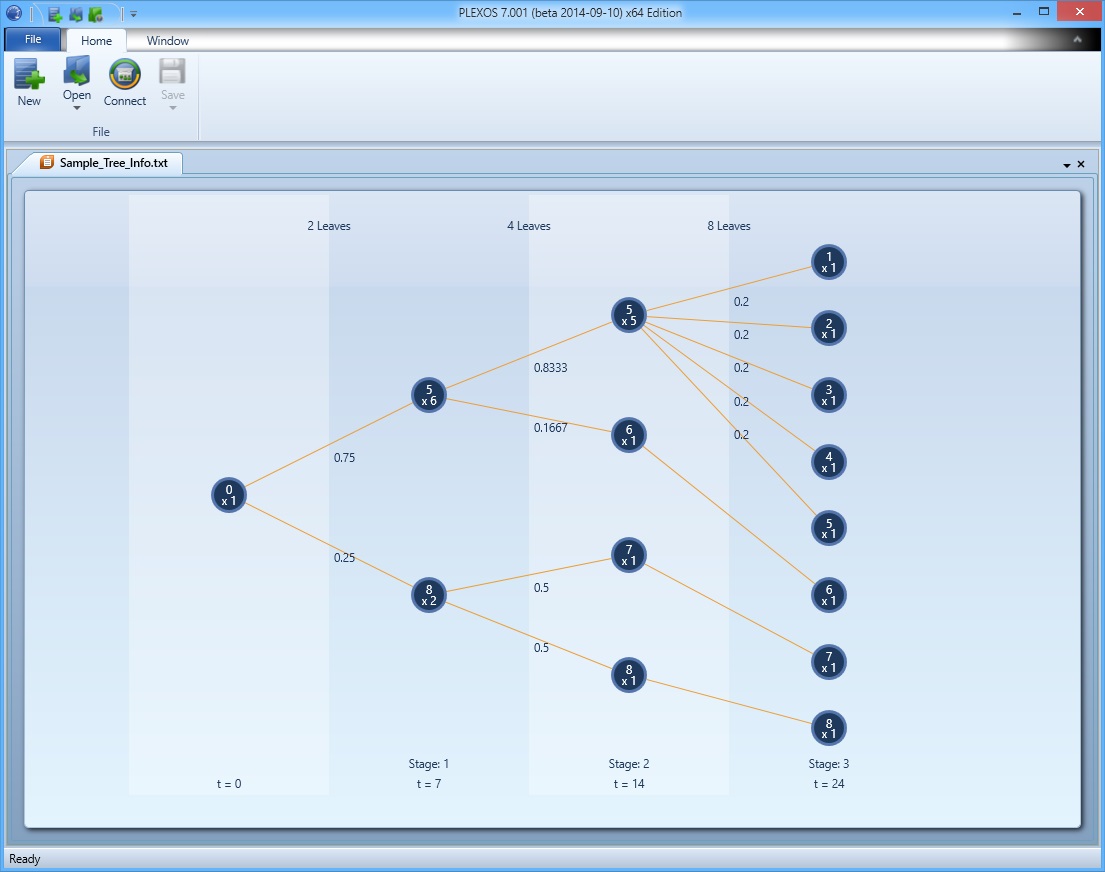 Figure 1: Diagnostic Scenario Tree Viewer
Along the top of the tree will be the count of leaves in each step and along the bottom will be the stage number along with its time period (t=#). The root node is the starting point on the tree and is where every other leaf and node branch off from. Within each node is written 'x #', this number represents how many leaves there are after this node. Leaves will connect one node to another and if there are multiple leaves originating from a single node, the weight of each leaf is written on the leaf.
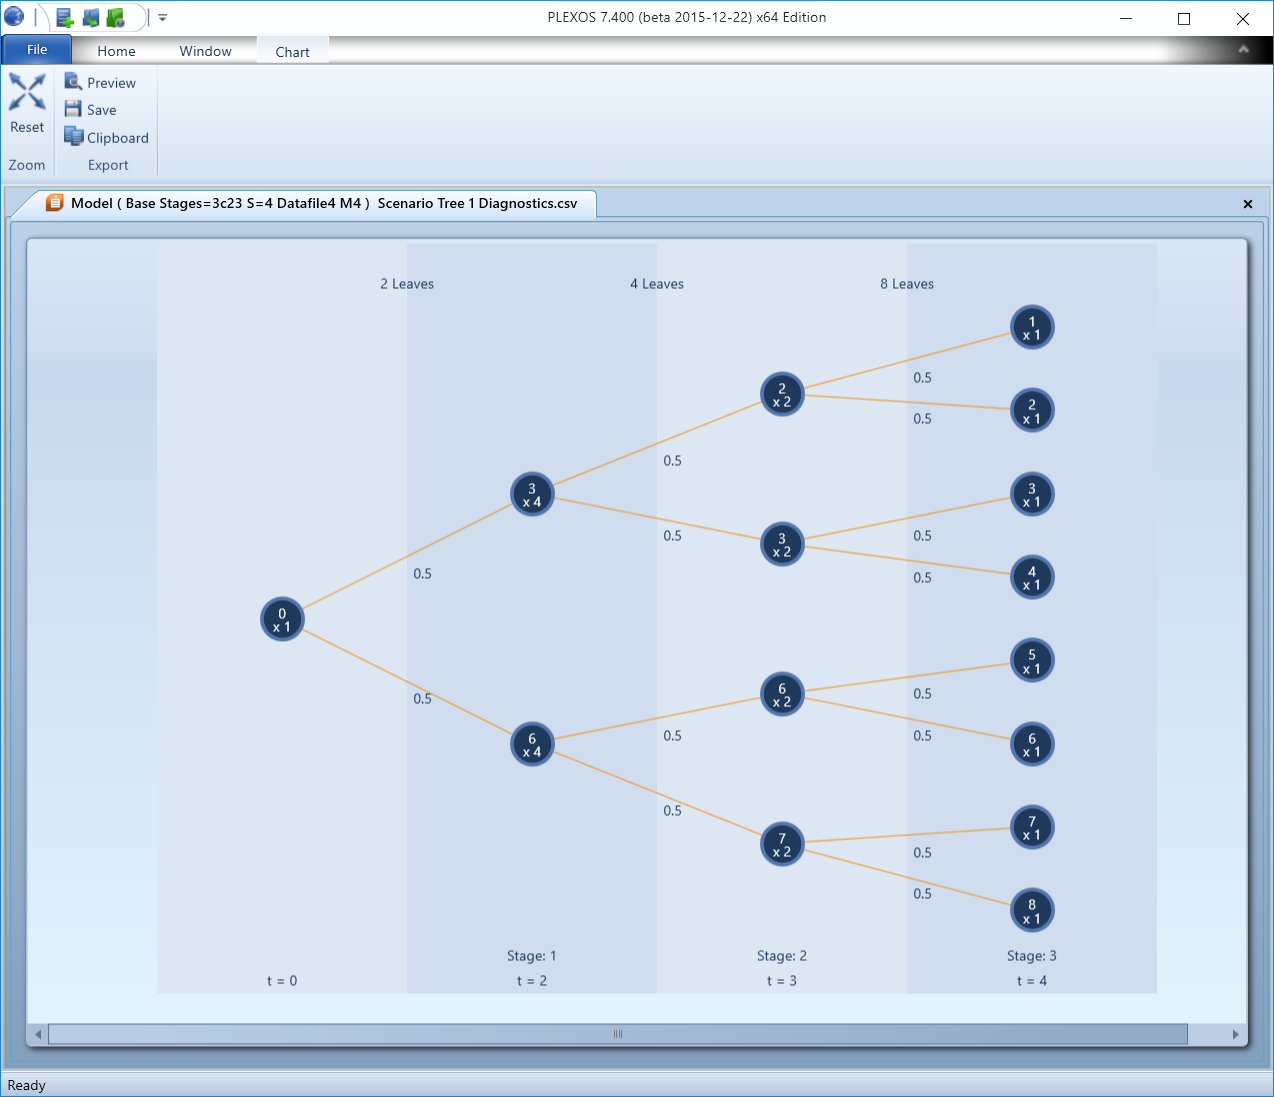 Figure 2: Zoom and export Diagnostic Scenario Tree Viewer
The scenario tree image can be zoomed with the mouse wheel and moved by mouse drag. To reset the position and scale, the "Reset" button is available on the ribbon inside the chart tab. Furthermore, the image can be previewed, copied or saved by pressing the buttons on the ribbon. User can also print the image using the preferred image viewer in preview mode.
2. Configuring a Scenario Tree in a Global Object
A scenario tree can be defined in a Global Object according to the information provided in the article multi-stage stochastic optimization. There is also a Scenario Tree Wizard for defining simple trees. This is accessed by right-clicking the Global collection in the user interface and selecting Scenario Tree Wizard. The following user interface is used to define the tree.
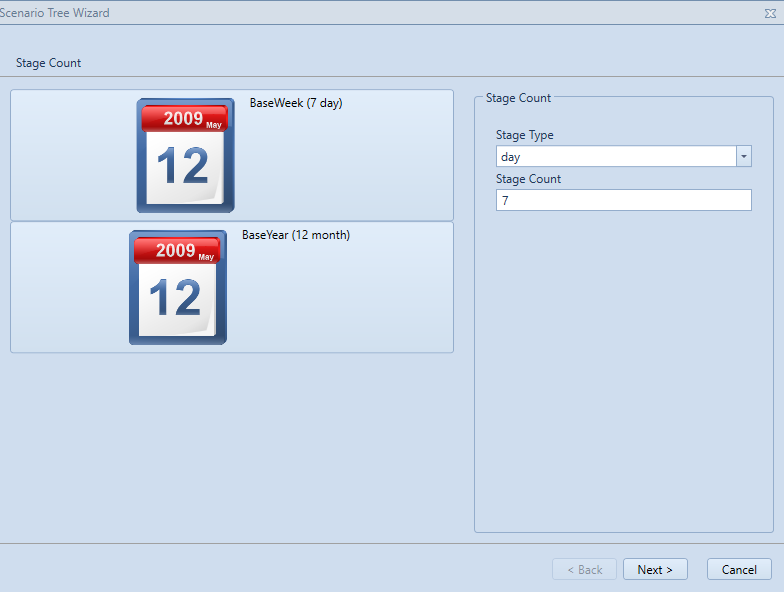 Figure 3: Define Period Type and Stage Count
The first page of the wizard lists the Horizon objects found in the database. These provide sensible values for the period type and stage count for the scenario tree. But the period type and stage count can be set to any value. The Horizon values are only provided for convenience.
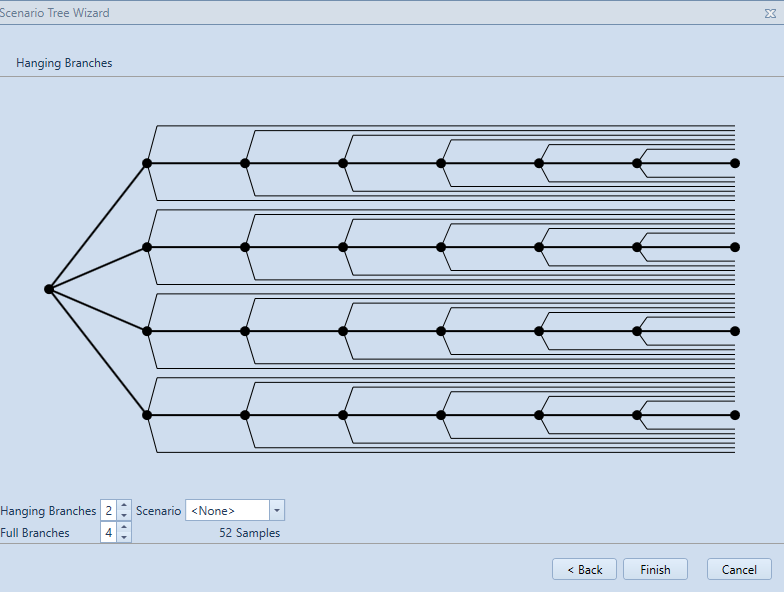
Figure 4: Define Full and Hanging Branch count.
The second page of the wizard provides a thumbnail view of the resulting tree. Full branches are shown as thick lines with the hanging branches indicated by lighter lines. The data created by the wizard can be tagged with a particular scenario from the drop-down list. The page also displays the resulting number of samples.
Selecting Finish will create a Global object if none is found. If a Global object exists, the scenario or base data for that object will be replaced. That is, only the data with the specified scenario (or base data) will be replaced. Data for other scenarios (or base data) are left intact.