PLEXOS 7 User Interface Guide Chapter 4
Contents
- Overview
- Document Tabs
- Explorer Pane
- Data Pane
- Filtering Data
- Sorting Data
- Clipboard Operations
- Excel Integration
- Tree Navigation
- History Navigation
1. Overview
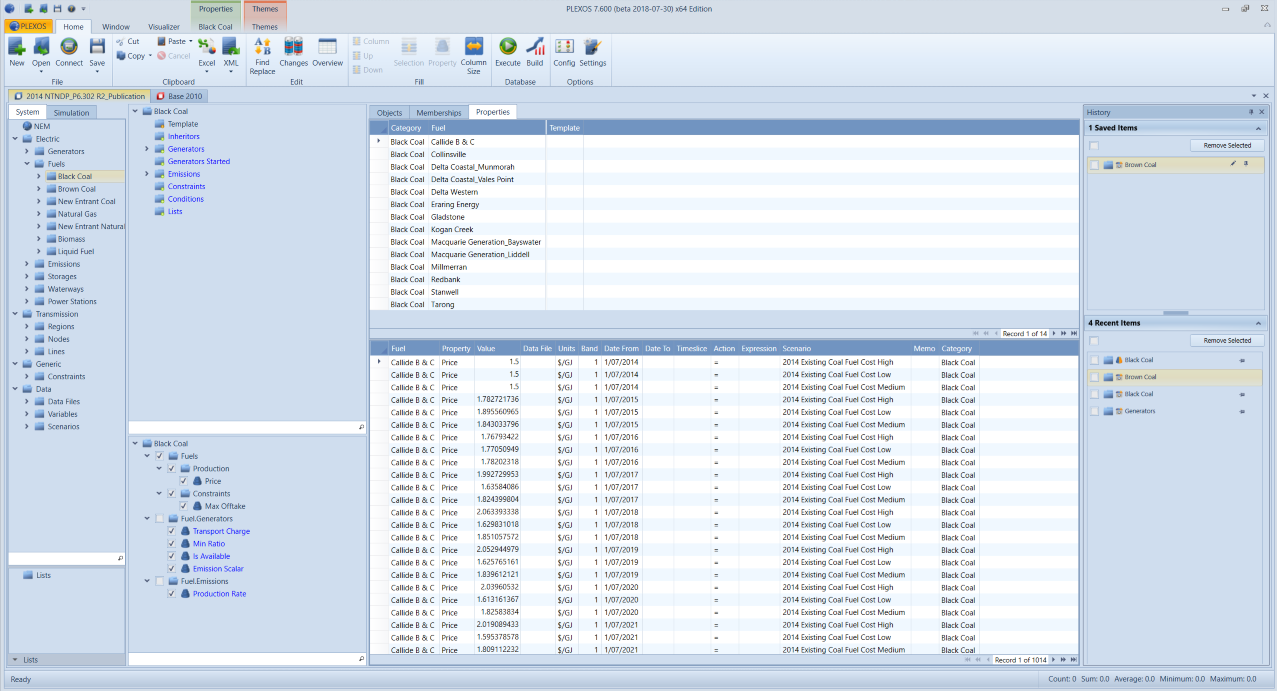
The following illustration shows how an input file is displayed when first opened in PLEXOS. The window is divided into two sections: the Explorer pane (sections labelled 1-4 on the left), and the Data pane (on the right). The Explorer pane has two tabs each with a tree: the System tree and the Simulation tree. The Data pane consists of three tabs: the Objects tab, the Memberships tab, and the Properties tab. The Explorer pane is split into two further sections that display information in tree layout for the selected collection or object.
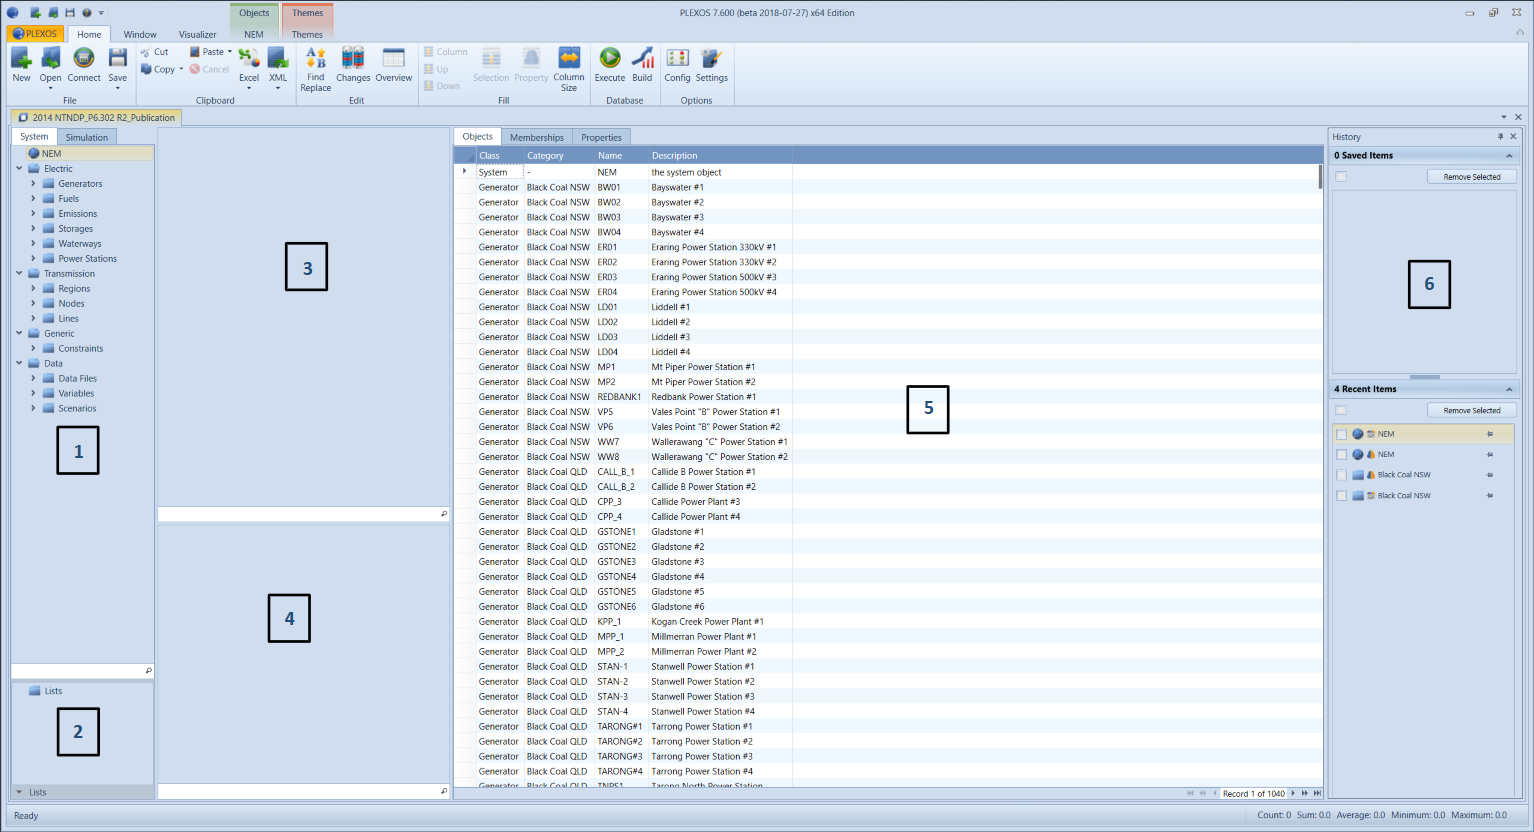
The numbering of the sections are:
- The Main Tree: Including the System and Simulation tabs, this tree shows the Objects in the database organized into Collections according to the object class (type of object).
- List Tree: Used to create lists of objects.
- Membership Tree: This tree displays all relationships
- The Properties Tree: This tree lists the properties available for the class of object selected in the Main Tree.
- Data Pane: This consists of three grids: Objects, Memberships and Properties.
- History pane: This consists of two lists: Saved and recent items
You can use the borders between each section to resize the grid and tree areas as you need. Simply hover the mouse over the boundary until you see the resizing arrows and drag the resizing handle to the position need. The relative size of the trees and grids is stored so that next time you start the interface your settings are restored.
2. Document Tabs
Each file you open in PLEXOS is shown in a document tab. The close button on the top right corner of the tab (as highlighted below) closes the tab and therefore closes the file. Different documents have a different coloured icon.

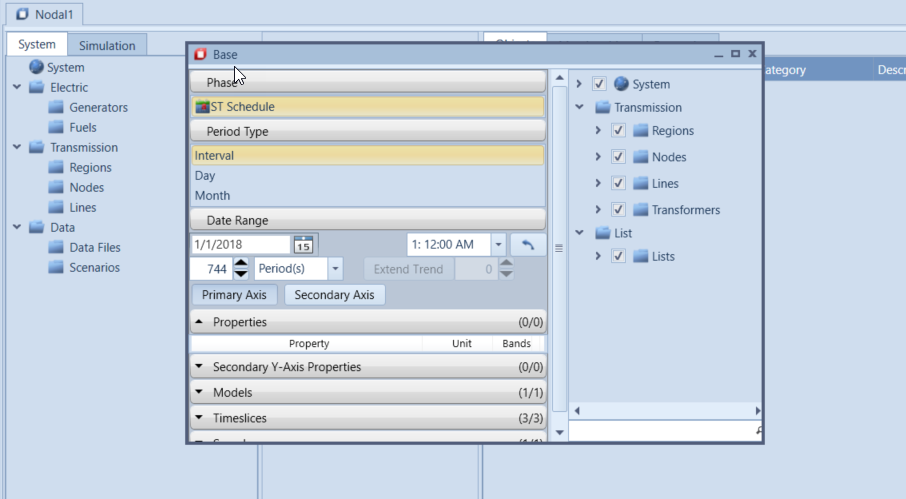
Whenever you open a new sub-window in PLEXOS (eg Execute Window, Properties Window, etc), the window fills the entire document tab area. These windows always provide a button to close the window in the bottom right area as in the following:

Make sure you use these buttons to close the active form, since closing the document tab will close the entire file, not just the active form.
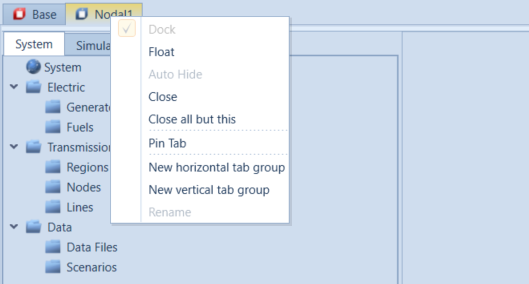
The document tabs can also be freely arranged by either floating or docking the windows. Right click on the tab to see the list of options:
 A Floating Window
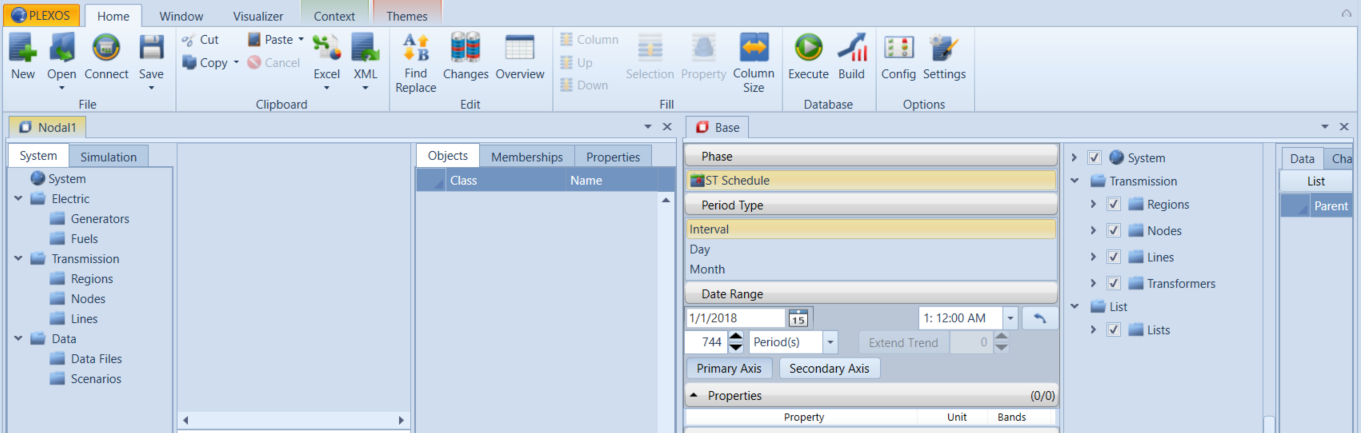 A Docked Window
The Properties tab of the Input Database Window can be pinned as a snapshot, allowing you to easily navigate between property views. A pinned tab's parameters (that is, the tree selections) cannot be modified. Any tree selections will apply to the main property tab only.
 Pinned Tabs
3. Explorer Pane
The Explorer pane displays the objects defined in the file. All objects pertain to either the System (defining the physical and economic elements of a power system) or Simulation (related to the execution of simulations) and are managed within the appropriate tree.
Objects are displayed in a hierarchical form beginning with the System object and its collections. Nodes can be expanded and collapsed using the controls that appear next to them.
Clicking on a node in the tree changes the contents of the Memberships tree, Properties tree and Data pane. When a collection or category is selected, data are displayed that pertain to all the objects in that collection or category, and when an object is selected, data are displayed that pertain only to the selected object.
A search function is available in each tree (System tree, Simulation tree, Membership tree and Properties tree). To quickly find an object, begin typing the name of the object you wish to search for. The tree will begin to filter out non-matching items. Click X to clear the search.
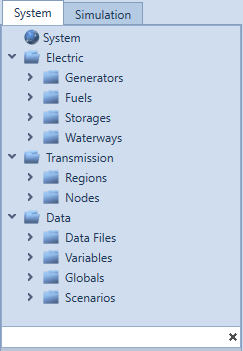 The Tree before searching.
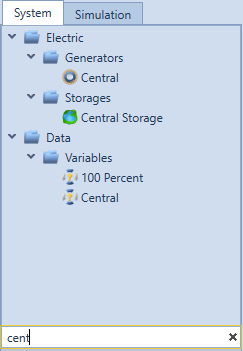 The Tree While typing a search term.
4. Data Pane
The PLEXOS GUI provides full data editing functionality. The object-oriented approach makes it easy to manipulate data across multiple objects simultaneously. For example, it is possible to display and edit the data for all Generator objects at one time.
The tab control on the Data pane changes the type of data being displayed.
Objects Grid
The objects grid displays lists of objects. From this window, objects can be added, renamed, or deleted. In Objects view, the Data pane shows these fields:
ClassName of the class the object belongs to.
NameName of the object: can be up to 50 characters, which can include spaces and many other special characters including any Unicode.
CategoryName of the object's category. This is optional and used only to sort the objects. Categories are defined directly on the corresponding System collection and can be selected in the Category drop-down box in the Data grid.
DescriptionA description of the object (up to 255 characters).
Custom ColumnsCustom columns can be defined in the Database Settings for a particular class, allowing you to associate your own arbitrary information with each object.
Memberships Grid
The Memberships grid shows what collections objects belong to: other than the default System collections, which are managed 'behind the scenes'. These memberships affect the way objects interact. For example:
- For a generator to inject energy into a node, the Generator must have a Node object in its [Nodes] collection.
- Some collections take only one member, but many can take more than one. For example, a generator can inject power into multiple nodes (more than one Node as members of its Generator Nodes collection) and it can generate using one or more fuels (Fuel objects as members of its Generator Fuels collection).
In the Memberships view, the Data pane shows these fields:
CollectionName of the collection in the format "ParentClass.CollectionName."
Parent NameName of the object that owns the collection.
Child NameName of the object contained in the collection.
The direction of the collection's parent/child is predetermined and these relationships are displayed in the Memberships grid only in the defined direction though they are displayed in the trees in both directions. In general, PLEXOS defines the parent/child relationship where the relationship is most commonly a one-to-one.
In the PLEXOS Object Model, data can be defined on objects only when they belong to a collection. The Properties grid displays data defined on objects as members of collections. All objects must belong to one of the System collections, and most object properties are defined as members in those collections. However, you only need to create memberships between non-system objects as the System memberships are managed automatically by PLEXOS.
For example, the number of units installed at a generator is a property that is defined when the Generator object is a member of the System [Generators] collection, but the transport charge specific to delivery of a given fuel to that generator is a property of the Fuel object when it is a member of the Generator object's Fuel collection. These memberships are referred to as second-level memberships, as opposed to System memberships.
Properties Grid
In the Properties grid the properties of the respective objects are set. The data pane is split into two sections, the Static property grid and the Dynamic property grid. The static property grid contains properties which are defined with a single 'static' value. Dynamic properties can take a different value according to a number of defined rules. Note that properties can be moved from the static to dynamic grid using the Configuration window: see Configuration.
When selecting an object that can be tagged in another object's dynamic property (e.g. data files and scenarios), an extra grid called 'Tagged' may be presented. This tagged grid will show all dynamic properties that have been tagged with the selected objects while the 'Data' grid will continue to show the dynamic properties for the selected objects. The 'Data' and 'Tagged' grids will be dynamically shown based on if there are any dynamic properties for the selected objects and if the selected object can be tagged in other dynamic properties.
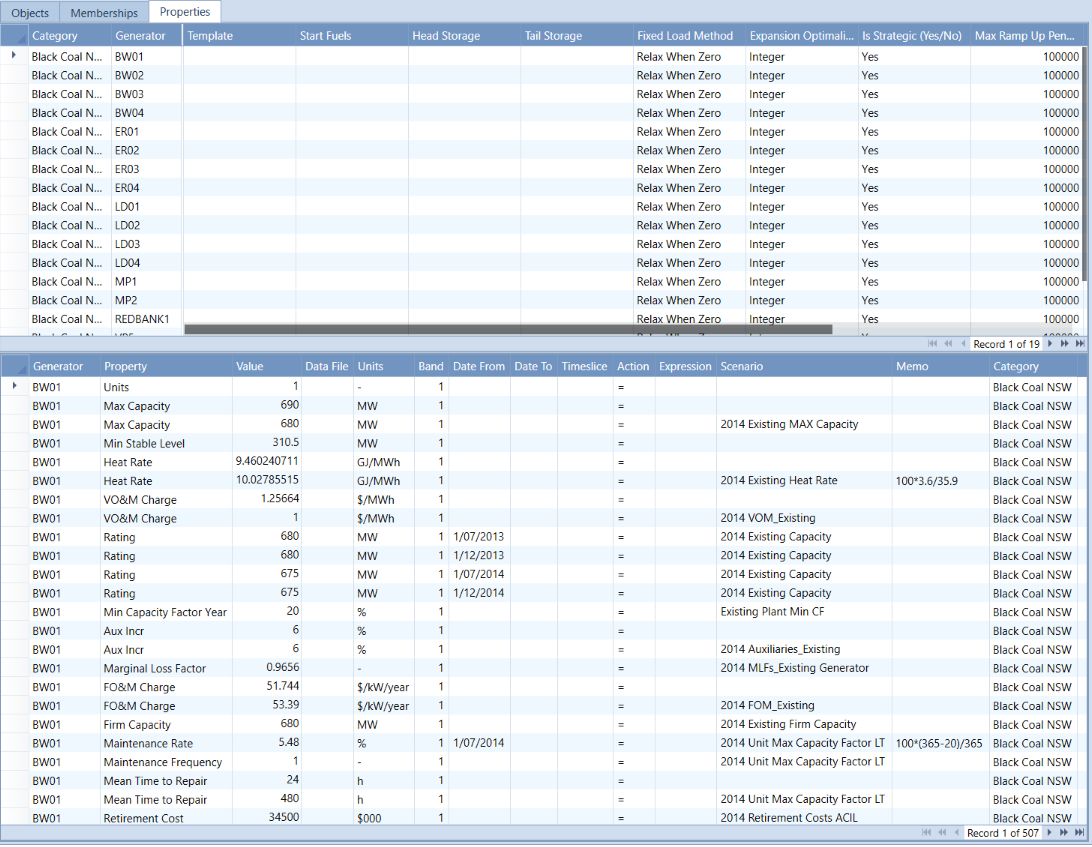 Static(Top) and Dynamic Data (Bottom) Grids
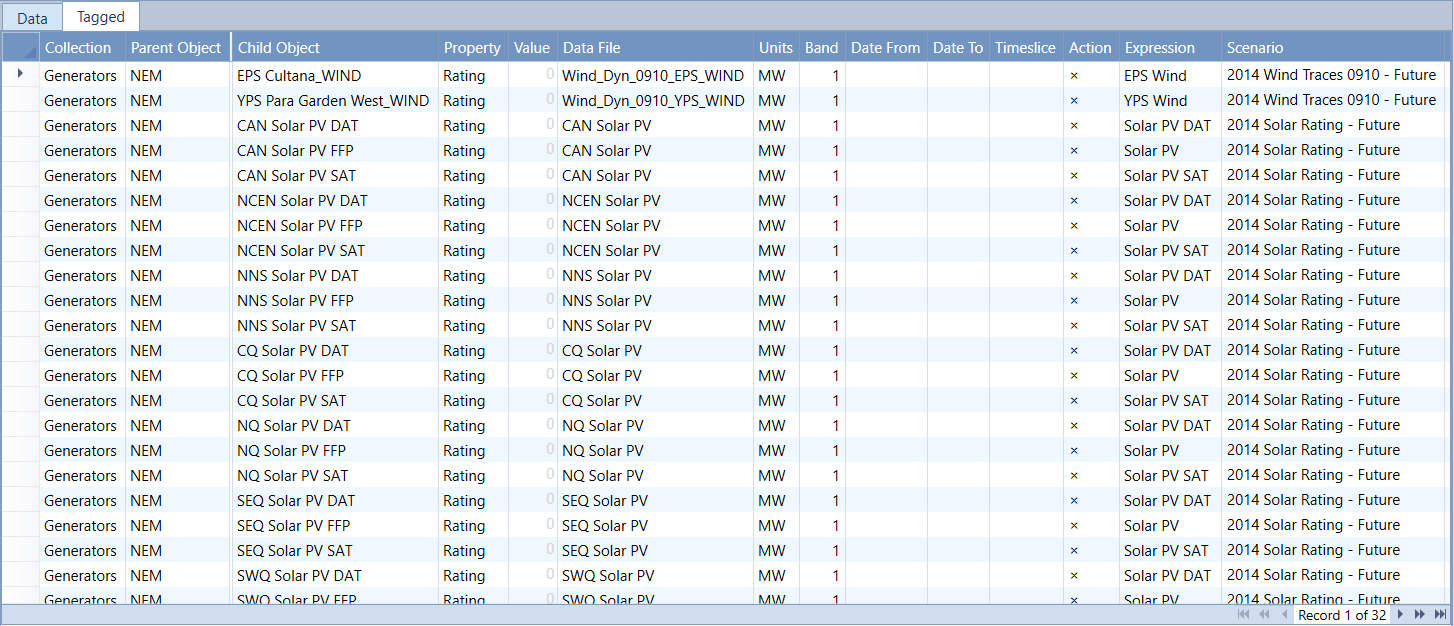 Tagged Data Grid
5. Filtering Data
The GUI supports filtering and sorting of data in most data grids. In the Properties grids, the Property tree behaves as a filter. For example, to display a list of all Generator Max Capacity property values for generators, click on the Generators collection in the System tree, then on the Properties tab of the Data Pane. Finally, click on the [Max Capacity] property in the Properties tree.
Data can be further filtered using the filter popups filter icons which are activated by clicking on the filter icon within column headers.
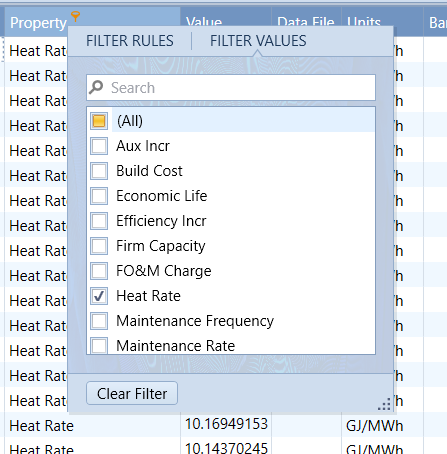 Filter by values
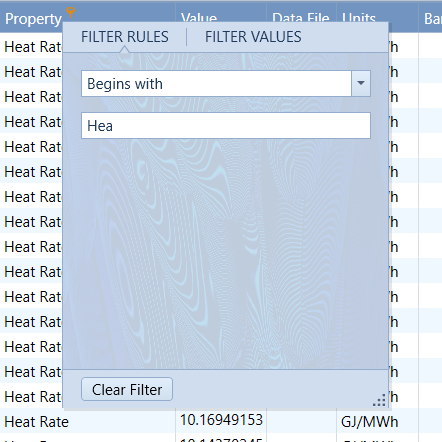 Filter by rules
To clear the current filter, click the Clear Filter button in the popup.
Lists can be also be used to filter data. See Lists. Additionally Lists can be generated from filtered grids by right clicking on the grid and choosing the Generate New List context option. Selecting this option will create a new list containing all objects referenced in the currently selected grid. To learn more about how filtering applies the logic, OR or AND, to objects in the lists, see the article, List Filtering Logic.
6. Sorting Data
Data in the grids are sorted by default according to:
- Collection: System collections display first before second-level collections i.e. those involving a membership to two non-system objects.
- Membership: Memberships are sorted first by object category and then alphabetically on object name.
- Property: Property order is pre-defined. The order is set to place the most commonly used properties near the top of the list.
In the dynamic properties grid the data are further sorted by the data tag fields (Date From, Date To, etc). The default sort order can be overridden temporarily at any time by clicking on the column of the grid you wish to sort by.
7. Clipboard Operations
The Cut, Copy, and Paste commands provide clipboard operations for all data grids. These allow you to copy data to an external program in plain text format. Note that only the current selection is copied:
- To make a selection simply drag across the cells you want to copy.
- To copy entire rows drag down the row selectors.
- Similarly with columns, hover over the first column until you see the selection arrow (downward facing arrow) then drag across the column headers to select multiple columns.
- You can also use SHIFT and CTRL keys in combination with the arrow keys to make multiple sections.
When copying from a grid, by default only the content of the cells is copied. If you also want the columns headers to be copied to the clipboard, then use the right mouse button "Copy (With Headers)" command.
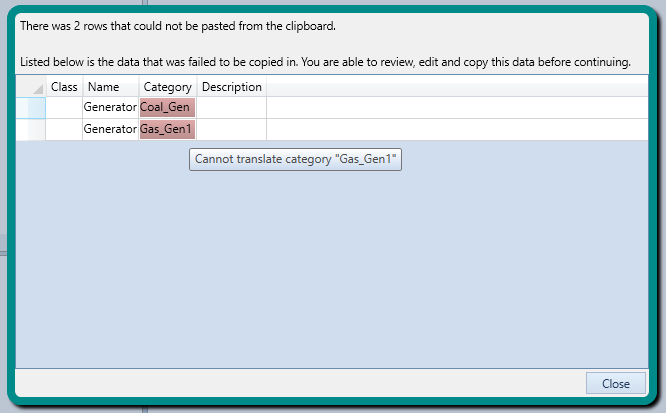
When pasting into a grid in the database window and an error occurs, you will be presented with the popup grid shown below. This grid will highlight the problem in red and provide a mouse over tool tip giving you a reason for the failure. You will be able to modify the data shown in this grid how ever you want but before closing it, you will need to copy any data you need as the data will be lost when the popup is closed.
8. Excel Integration
The Copy to Excel function conveniently copies the current grid selection to Excel.
This button has a dropdown menu of available options:
- Paste Into (New Sheet): Paste the current grid selection to a new Worksheet in a Workbook of your choosing.
- Paste Into (Current Position): Paste the current grid selection to a block beginning at the current selection the Worksheet of your choosing (Requires Excel to be currently running).
- Paste All Into (New Sheets): Paste all grid data from each tab to new Worksheets.
This command supports all versions of Excel since Version 9
9. Tree Navigation
The trees in PLEXOS can be navigated using mouse-clicks or by using the keyboard arrow keys. From the membership tree you can use the right-mouse-button Locate command to jump the main tree to the location of any object referred to in the membership tree. For example you might click a Generator in the main tree then locate one of the Fuel objects it uses.
10. History Navigation
The History panel is another way you can navigate through PLEXOS quickly.
 History Panel in Editor
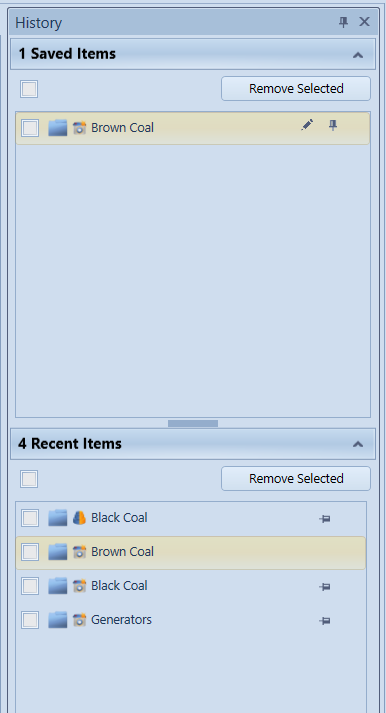 History Panel in detail
As you navigate through the trees in PLEXOS, the program keeps track of the nodes you have visited. The most recent 20 are added to the recent items list. By double clicking on an item on the list, the interface will jump to the last state of the screen associated with the object. This includes preserving the current grid tab and any property / membership interfaces open at the time. The icons to the left of the object description denote the state of the interface. By pressing the pin button on the right of the list, the item will be added to a saved list. This list can contain a list of favourite items that are saved for quick reference. These items can be renamed. Each project keeps its own History list and this is loaded when the project is opened. The application now loads the last open item when a project is loaded so that the user can resume where they left off.