Preview Class
| Description: | Preview of the input data used |
| Detail: |
Contents
1. Introduction
The "Preview" phase is distinct from other phases, such as LT Plan, MT Schedule, etc., in that it is not an optimization phase, but rather a pure data phase. It has been designed so that all raw input data, which is is used by the current model, will be written out to the solution database. This allows all input data to be quickly and easily validated/audited. For example, it may be difficult to review data defined by multiple data entries and/or from multiple data files, but this can now be viewed easily via the solution view.2. Preview Phase
The preview phase can be enabled by creating a membership between the Preview and Model classes. The horizon used is directly tied to the chronological Horizon settings, where a subset of the full chronology horizon can be selected or alternatively the typical week values used. It will run using steps as defined in the chronological horizon settings, for example two years of daily steps:
Preview -->
Completed Preview Step 1 of 730. Time: 00:00:00.0. Elapsed:
00:00:00.0. Remaining: 00:00:28.4. Memory: 184 MB (0.07% of 261,742)
Completed Preview Step 2 of 730. Time: 00:00:00.0. Elapsed:
00:00:00.0. Remaining: 00:00:19.1. Memory: 184 MB (0.07% of 261,742)
...
...
...
Completed Preview Step 729 of 730. Time: 00:00:00.0. Elapsed:
00:00:06.4. Remaining: 00:00:00.0. Memory: 182 MB (0.07% of 261,742)
Completed Preview Step 730 of 730. Time: 00:00:00.0. Elapsed:
00:00:06.4. Remaining: 00:00:00.0. Memory: 183 MB (0.07% of 261,742)
Preview Completed. Time: 00:00:06.8
<-- Preview
3. Reporting
All input properties used in the model will be outputted directly to the solution data set (zip file), including Project solutions. This data consists of the following:- All interval data for all input properties
- Multi-sample input data (i.e. post-sample creation values for tagged properties)
- Multi-band input data
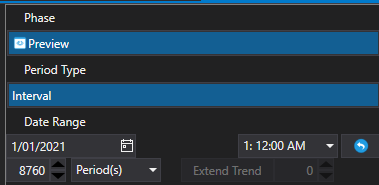
Loading a solution database, via the user interface, will show the Preview phase in the list of simulated phases - see below. Please note that summary data is not supported.

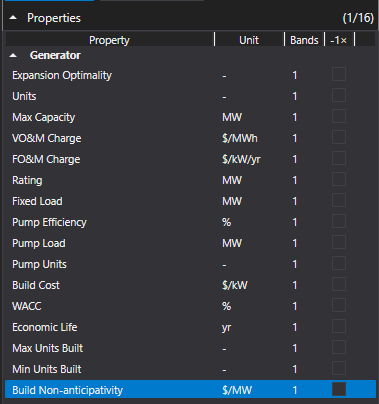
Each collection will list all input properties defined and used in the simulated model. The screenshot below shows the generator input properties used for this particular model.

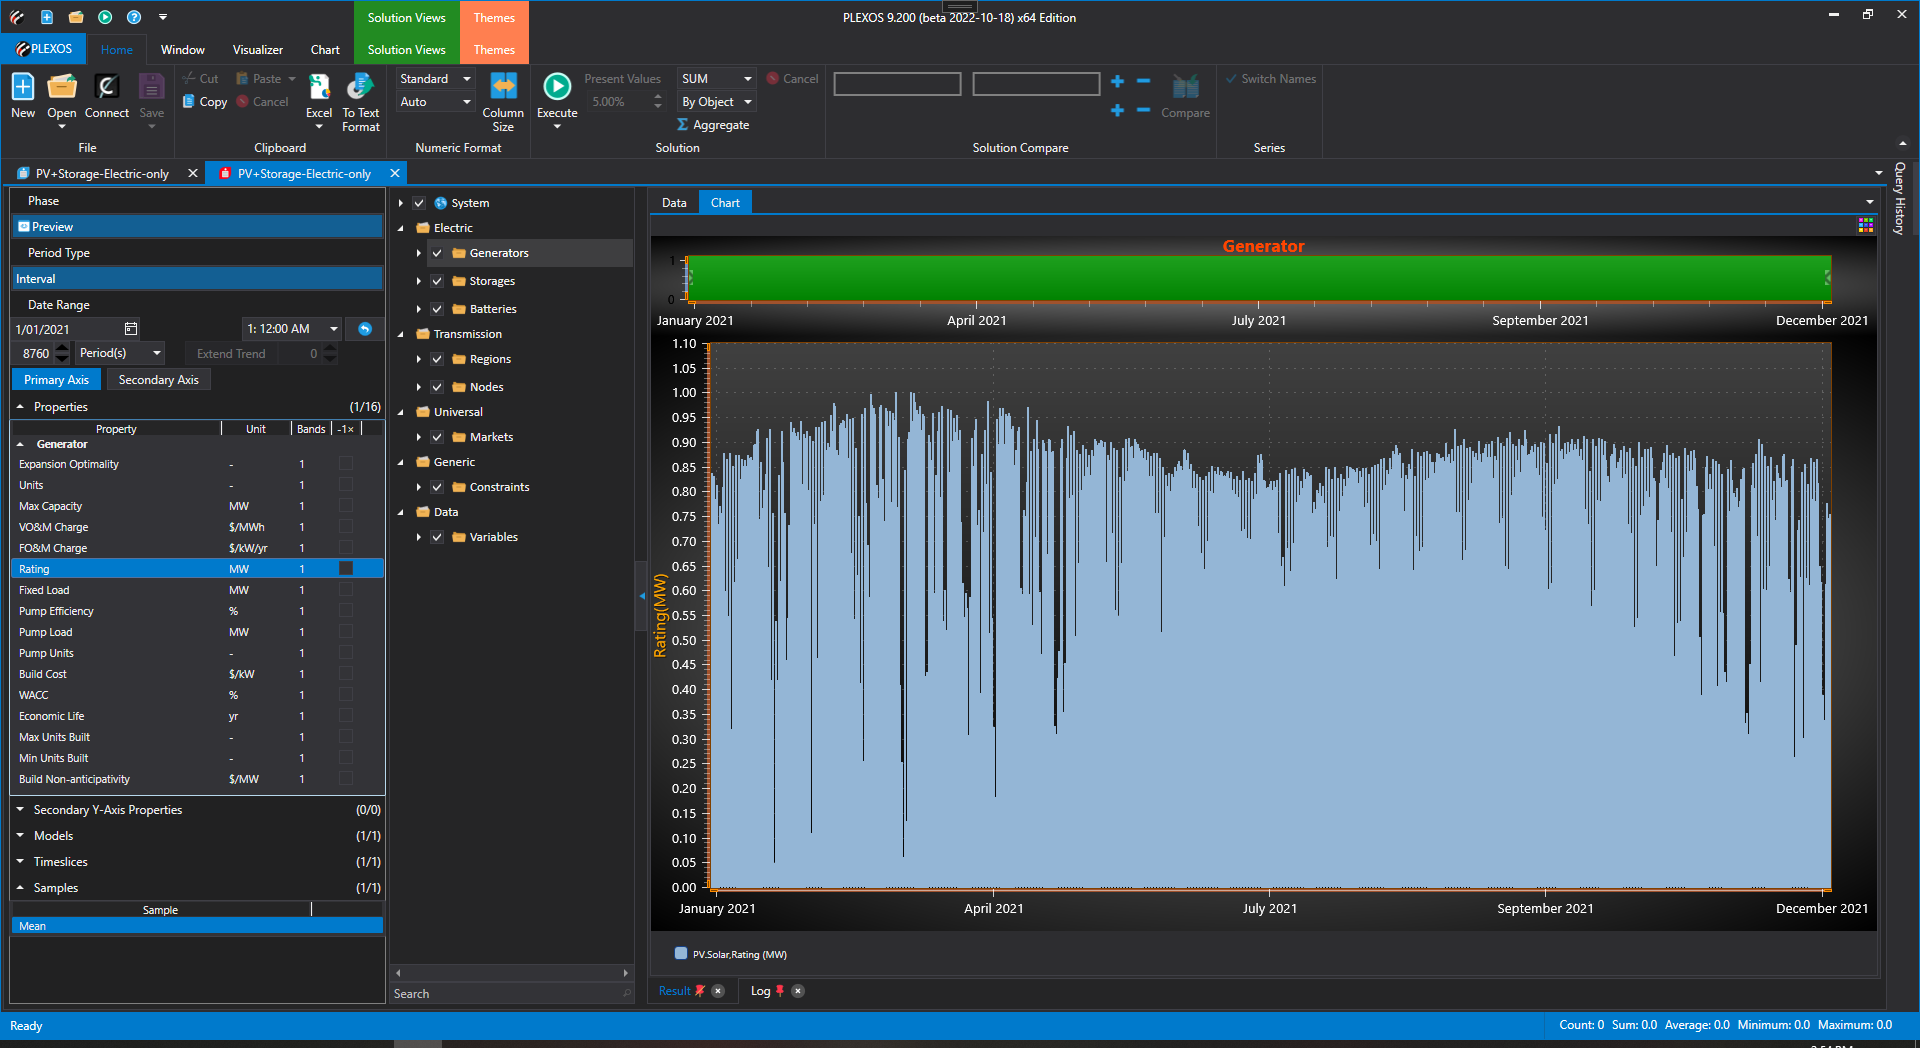
These properties can be queried just as any other reporting property can, e.g. the data can be displayed in tabular or chart form, while supporting all user interface functionality for these data series, such as data pivoting, filtering, statistic summary, histograms, etc. This screenshot shows the Rating value defined for the solar generator, where its value is defined via a stochastic variable.
