Period Output Accounting Methodology
When Aurora is not running all hours and all days, it is necessary to scale the sampled hours to values that represent a run of all hours and all days for the time period. Below is a description of how that scaling is handled. Aurora output consists of some average results (such as Price, Capability, etc.) and some cumulative results (such as Output_MWH, Total_Fuel_Cost, etc.). How those averages and accumulations are handled is also described below.
Daily (such as ResourceDay, ZoneDay, etc.) period AVERAGE values use direct averaging for all averages (sum of sampled hourly values/number of sampled hours for the period condition)
Daily period CUMULATIVE values effectively take the average value observed for the period condition in the sampled hours and ratio up for the number of hours defined to be in the period condition. The formula is (number of hour in day or condition / number of hours sampled in a day or condition day) * daily average value.
![]() NOTE: Condition (On-Peak, Off-Peak, etc.) cumulative values will sum to period cumulative values only if running all hours, or the sample hour configuration draws from each condition in the same proportion as the conditions represent within the day (e.g., C1=8 hrs, C2=16 hrs, Day hours sampled = 6 with 2 hrs in C1 and 4 hrs in C2).
NOTE: Condition (On-Peak, Off-Peak, etc.) cumulative values will sum to period cumulative values only if running all hours, or the sample hour configuration draws from each condition in the same proportion as the conditions represent within the day (e.g., C1=8 hrs, C2=16 hrs, Day hours sampled = 6 with 2 hrs in C1 and 4 hrs in C2).
Monthly (such as ResourceMonth, ZoneMonth, etc.) period AVERAGE values (such as Price, Capability, etc.) use direct averaging for all averages (sum of sampled hourly values/number of sampled hours for the period condition).
Monthly period CUMULATIVE values (such as Output_MWH, Total_Fuel_Cost, etc.) will be calculated using either 1 or 2 below:
-
If the dispatch sample dispatches every day of the month, the monthly cumulative values will be the sum of appropriate condition values from the daily results.
-
If the dispatch sample does not dispatch each day of the month, the monthly cumulative values equal the average value observed for the period/condition in the sampled hours with ratios applied for the number of hours defined to be in the period/condition. The ratio = number of hours in period condition / number of sampled hours in that period condition.
![]() NOTE: In the case where the entire month is not included in the study, the daily cumulative values will be scaled up as if all days of the month have been included in the study. For example, if the study term is from 3/1/05 to 4/2/05 so that only two days were run in April the monthly cumulative values will be scaled up by a factor of 15 to represent 30 days. These results will also roll up to the year and study reports.
NOTE: In the case where the entire month is not included in the study, the daily cumulative values will be scaled up as if all days of the month have been included in the study. For example, if the study term is from 3/1/05 to 4/2/05 so that only two days were run in April the monthly cumulative values will be scaled up by a factor of 15 to represent 30 days. These results will also roll up to the year and study reports.
Annual (such as ResourceYear, ZoneYear, etc.) period AVERAGE values use direct averaging for all averages (sum of sampled hourly values/number of sampled hours for the period condition).
Annual period CUMULATIVE monthly values will be the sum of appropriate condition values from the monthly results.
![]() NOTE: In the case where the entire year is not included in the study, the monthly cumulative values will be scaled up as if all months of the year have been run. For example, if the study term is 4/1/05 to 5/31/05 so that only two months were run in 2005 the monthly cumulative values will be scaled up by a factor of 6 to represent 12 months. These results will also roll over to the study reports.
NOTE: In the case where the entire year is not included in the study, the monthly cumulative values will be scaled up as if all months of the year have been run. For example, if the study term is 4/1/05 to 5/31/05 so that only two months were run in 2005 the monthly cumulative values will be scaled up by a factor of 6 to represent 12 months. These results will also roll over to the study reports.
Study period AVERAGE values use direct averaging for all averages (sum of sampled hourly values/number of sampled hours for the period/condition).
Study period CUMULATIVE annual values will be the sum of appropriate condition values from the annual results.
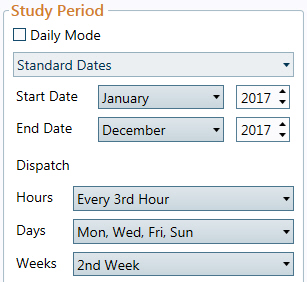
The following is an example of how an aggregated cost, such as Total_Fuel_Cost, is scaled from a small sampling to represent an all hour, all days run. The example is a run with the following dispatch hours: one week a month (2nd week), 4 days a week, and every 3rd hour (in the days that run). From this example, you will see that with the way scaling is handled the monthly aggregate values may not be exactly the same as summing your daily aggregates.
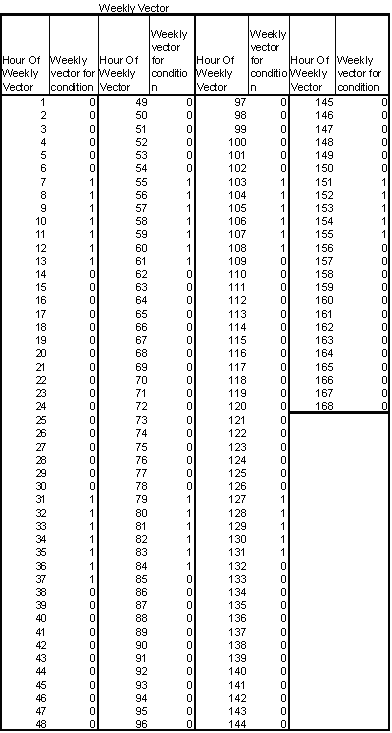
The example follows both Average and a Condition represented by the weekly vector in the following table. The table below depicts the weekly vector profile used for the Condition in this example.
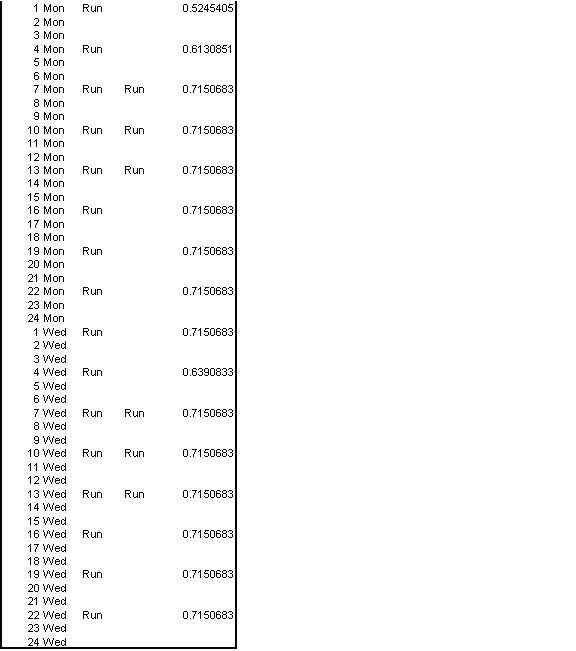
The table below is a breakdown of the hours and days sampled in this one month Run.
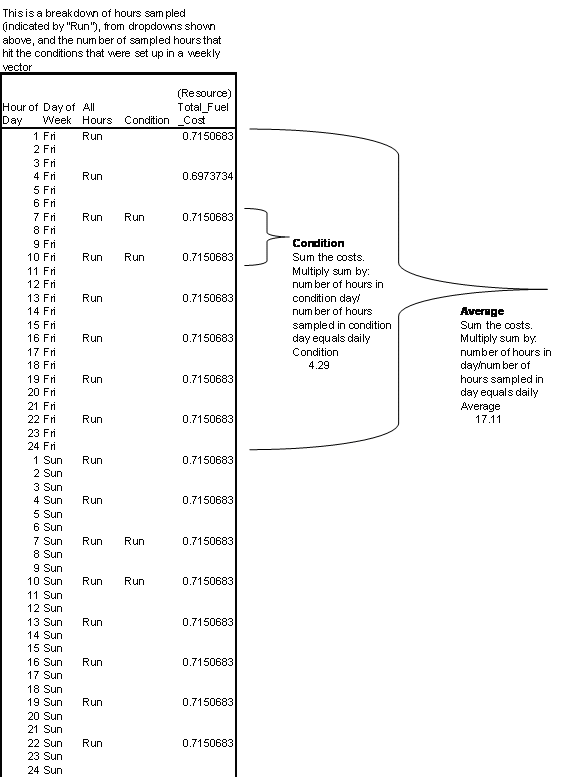
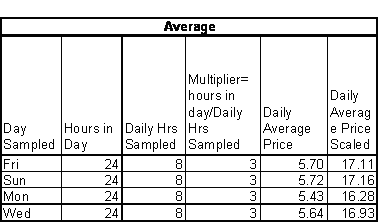
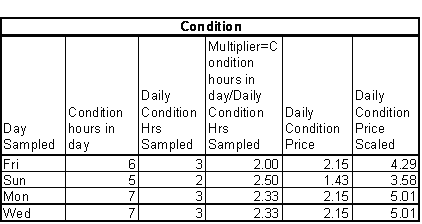
Daily values are aggregated from the hourly results. The following formula is used to get the daily results for both average and condition:
(Hours in Day or Condition / Hours Sampled in Day or Condition) * Daily Average Price = Daily Average Price After Scaling
Or
Average:
(24 / 8)*5.70 = 17.11
Condition:
(6 / 3)*2.15 = 4.29
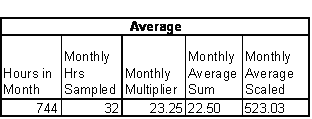
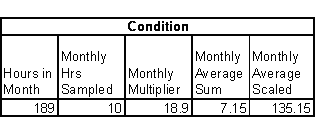
Monthly values are also aggregated from the hourly results. The following formula is used to get the monthly results for both average and condition:
(Hours in Month or Month Condition / Hours Sampled in Month or Month Condition) * Monthly Average Price = Monthly Average Price After Scaling
Or
Average:
(744 / 32)*22.50= 523.03
Condition:
(189 / 10)*7.15 = 135.15
Annual aggregations require no adjustment. It is simply a sum of the monthly results.
![]() Period Output Accounting Methodology
Period Output Accounting Methodology