Supply Curve Table
The Supply Curve table is used to set up emission supply curve segments to be used in conjunction with emission constraints defined in the Constraint table. This allows the emission price for resources in the constraint set to dynamically increase as the level of emissions increases.
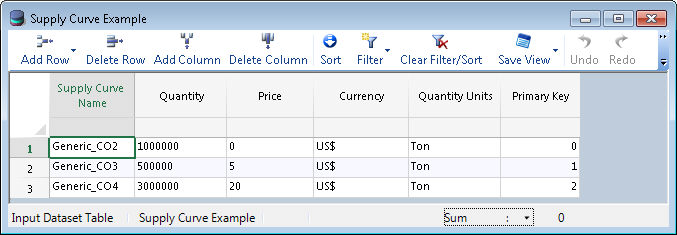
In the example below, suppose that there is a constraint set with a CO2 emission constraint which references this supply curve. The cost of CO2 emissions in $/tons for resources in this set would be 0 if the total annual emissions in the constraint set was less than 1,000,000 tons. If the total emissions of the set fell between 1,000,000 and 1,500,000 the cost of CO2 emissions for these resources would be $5/ton. If the total emissions were between 1,500,000 and 4,500,000 then the cost would be $20/ton.
|
COLUMNS INCLUDE |
|||
![]() Supply Curve Table
Supply Curve Table