Simulation Progress 
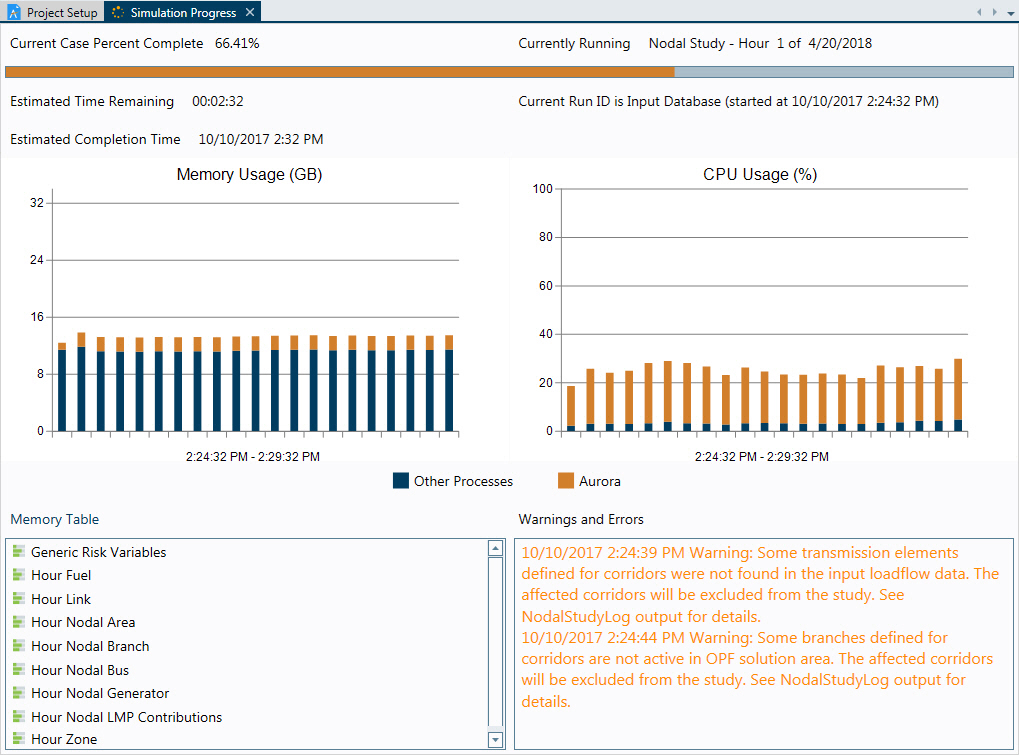
This window provides a dashboard for various items documenting the progress of the simulation during a run.
Simulation Progress Metrics
The first box shows various metrics regarding the simulation. The status bar is a visual representation for the simulation progress, with percent complete, current hour running, estimated time remaining and estimated completion time all showing as well.
Machine Usage
The next area shows the Memory Usage, but Aurora and the machine in general, and CPU usage by Aurora.
Memory Tables
This area is used to access the Memory Tables, which provide detailed hourly information about the current hour being run. Use this feature in conjunction with the Step button to run and review a study hour-by-hour.
Warnings and Errors
Finally, this box will highlight any warnings and errors that are typically written to the Status window.
![]() Run Management
Run Management
![]() Simulation Progress
Simulation Progress