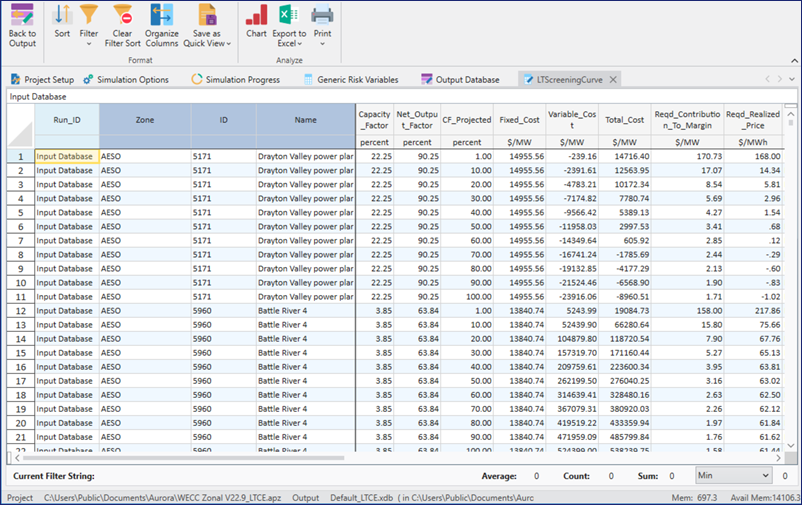
LTScreeningCurve Output Table
The LT Screening Curve output table is used to determine economic viability of new and existing resources relative to other resource options.
|
COLUMNS INCLUDE |
|||
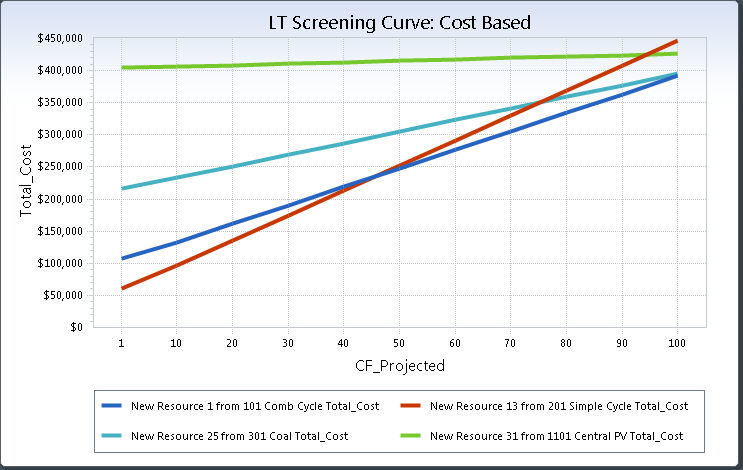
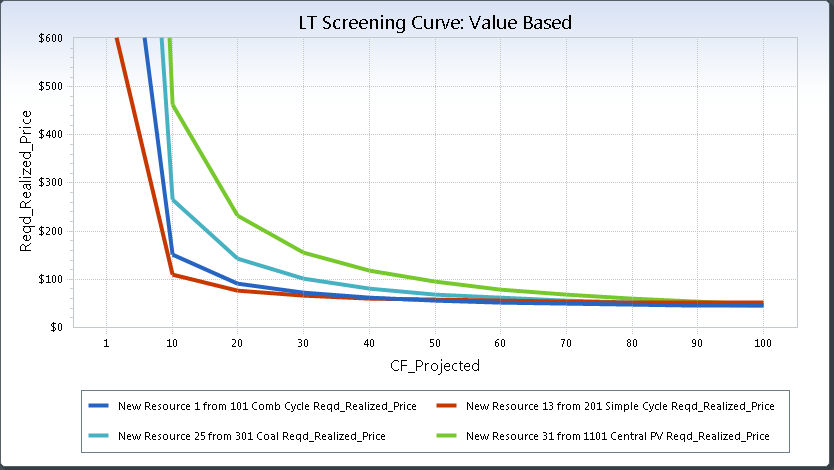
Example Charts
![]() LTScreeningCurve Output Table
LTScreeningCurve Output Table