Advanced Designer 
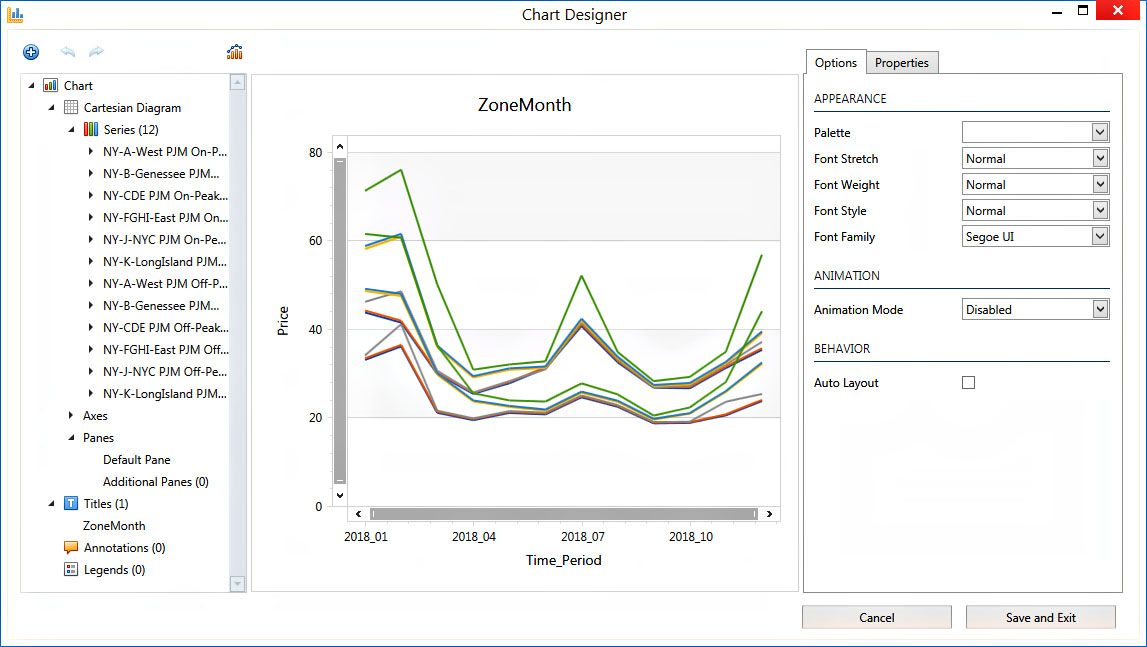
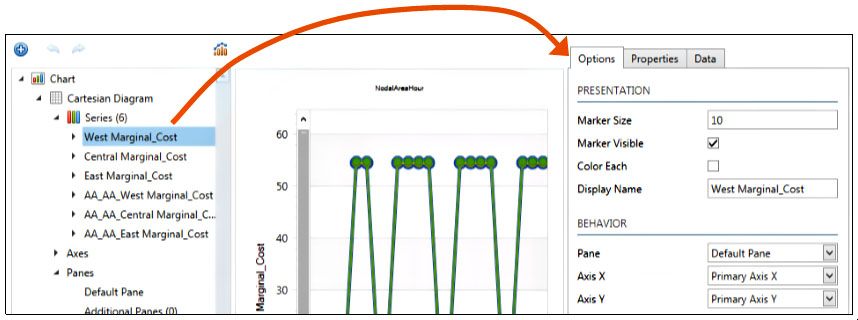
Use the charting Advanced Designer for more sophisticated, customized formatting of charts. On the left side of the window is a tree of Chart elements. Selecting an item from the tree on the left will update the Options available on the right where you can edit formatting and manipulate data.

There are three main sections under the Chart heading: Cartesian Diagram, Titles, and Legends. Selecting a part of the tree opens a two to three-tabbed editing pane on the right.
-
Options has a few common settings for easy access.
-
Properties is an in-depth menu for ultimate customization.
-
Data is used to further define chart data.

|
|
Chart
Select this heading to change color schemes, font styles, or turn on chart animation. |
|
|
Cartesian Diagram
Rotate the chart or enable axes navigation. Select a subheading of Series, Axes, or Panes to change marker style, size, or visibility. Additionally, there are many available Properties to customize in the Series heading. |
|
|
Titles
Select this heading to change the location, alignment, and content of the title, toggle the title visibility, and customize font settings for the title. |
|
|
Legends
The legend heading is used to input a legend title, change the location and layout of the legend, toggle visibility, and customize font settings for the legend. |
![]() Productivity Tools
Productivity Tools
![]() Advanced Designer
Advanced Designer


