Chart Setup 
Click the Chart Setup button, or press F10, to open the Chart Setup window.
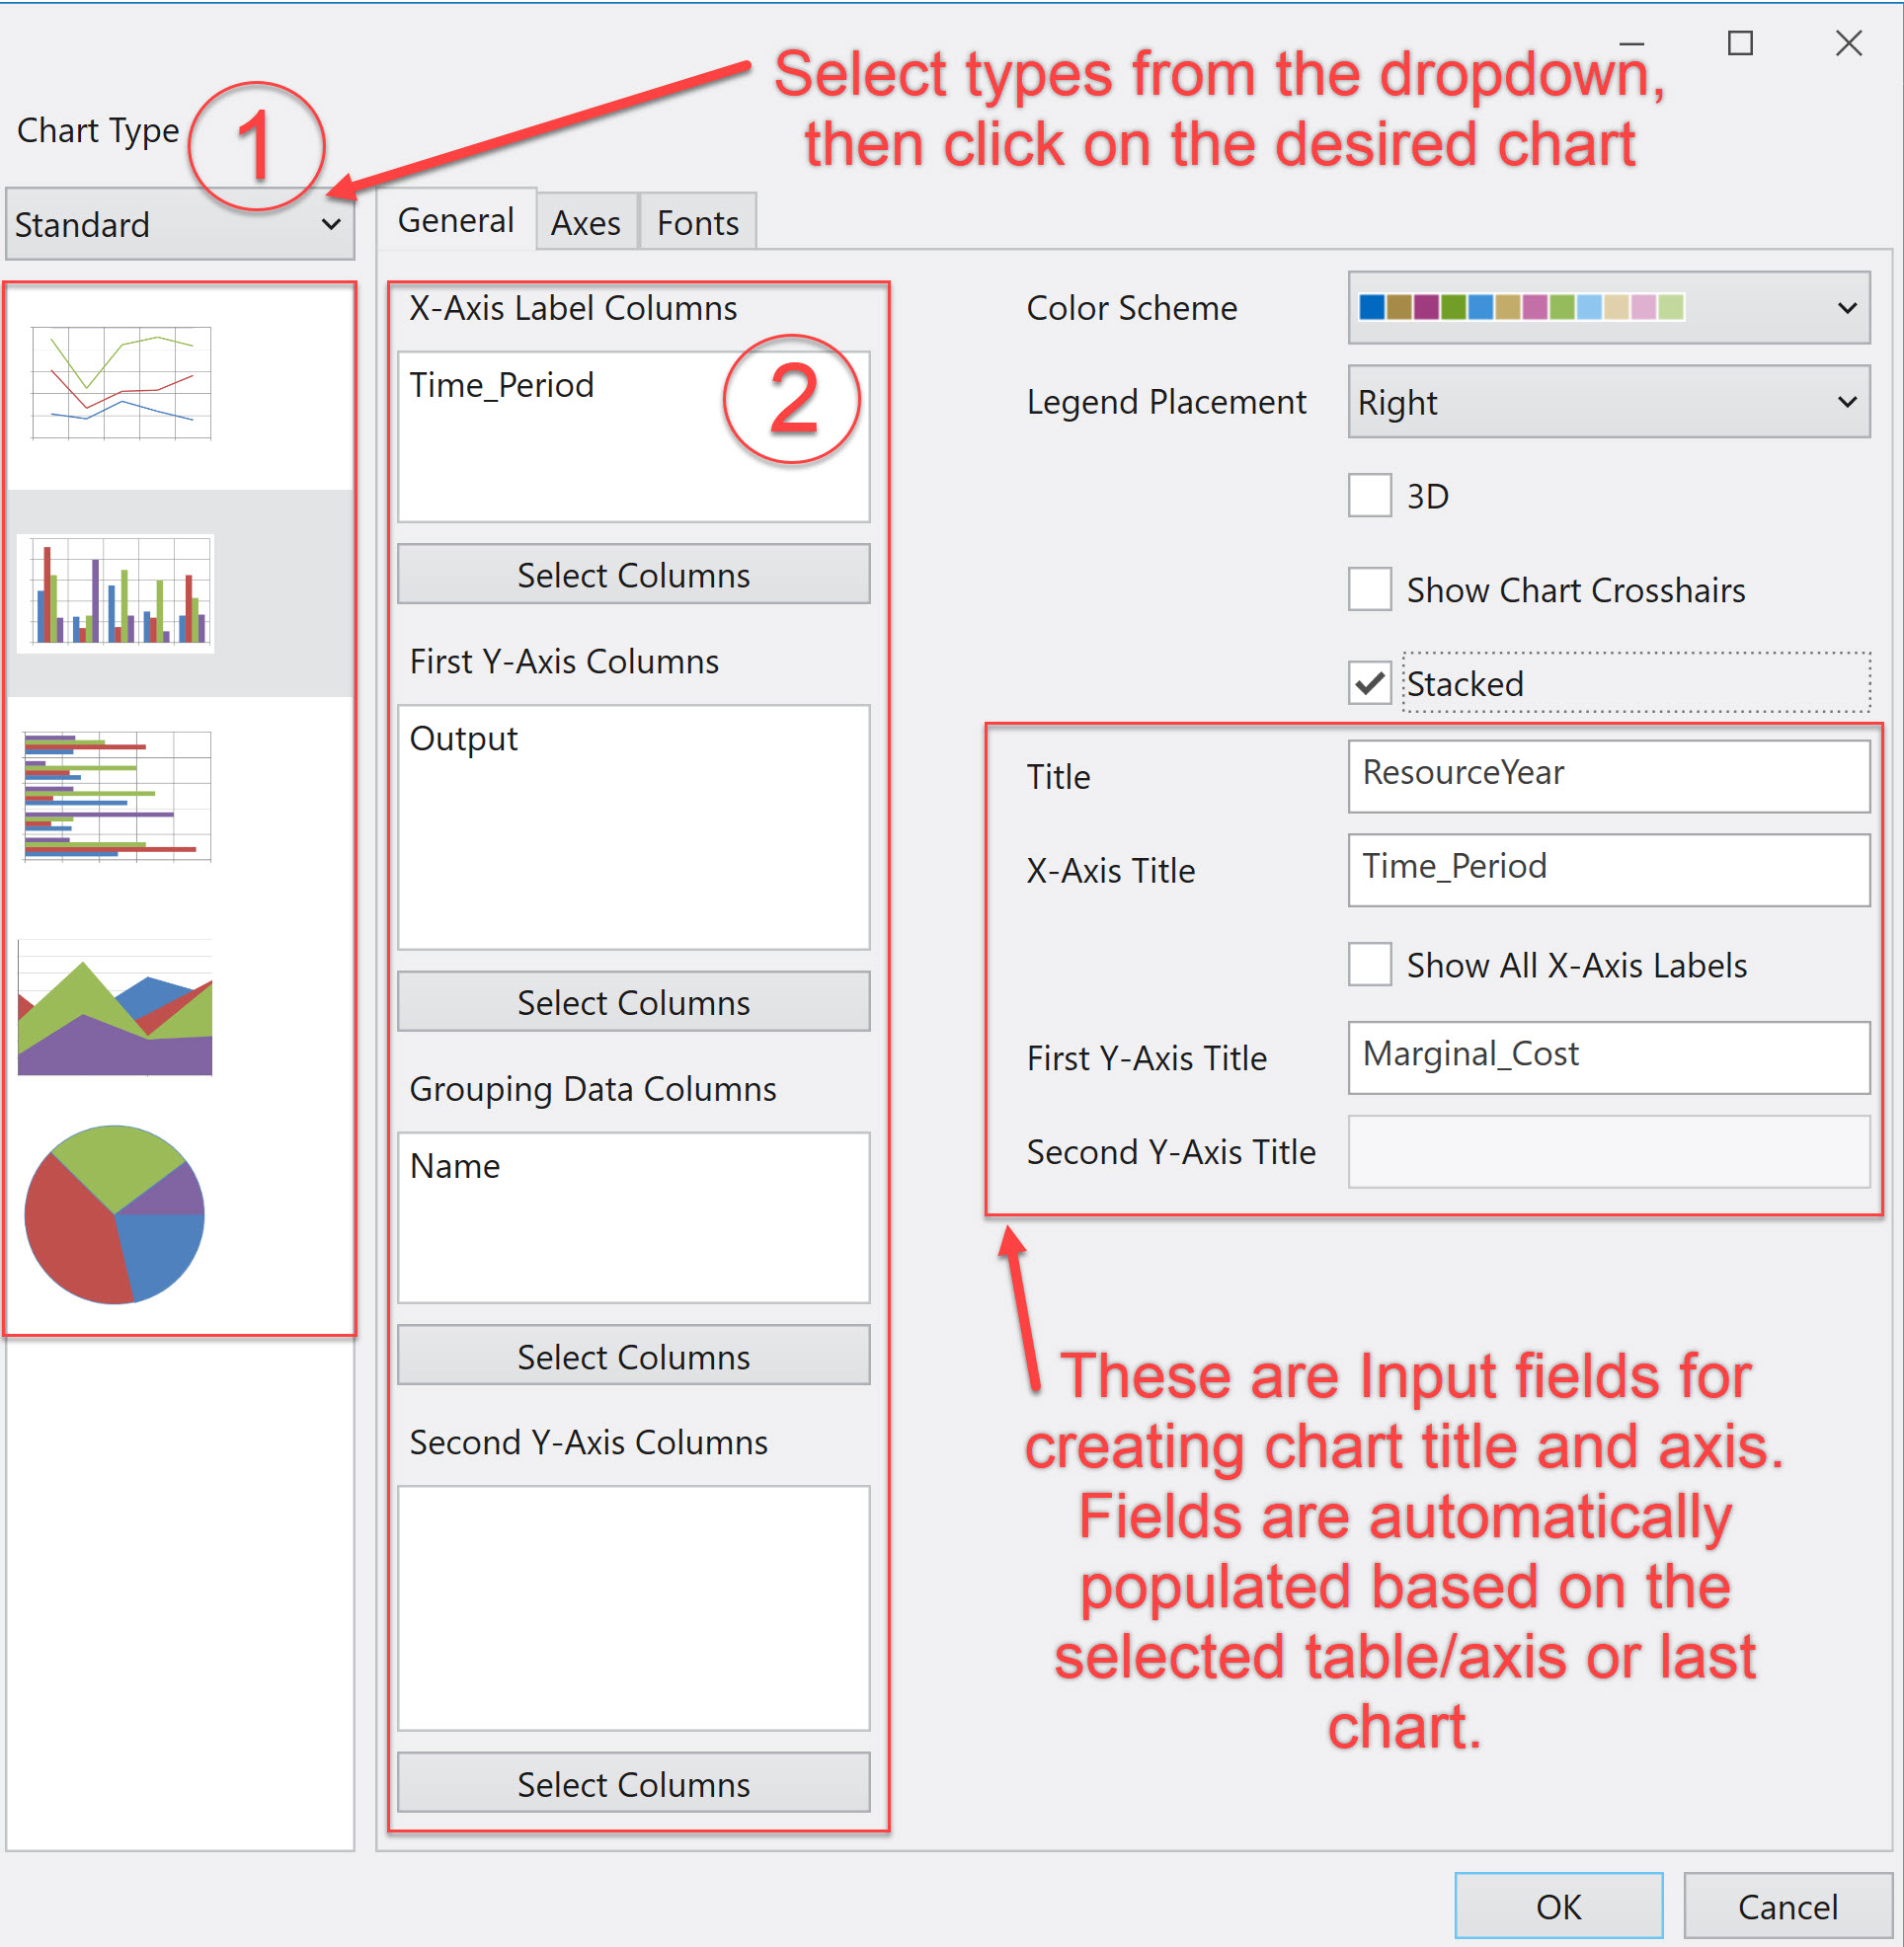
1. Chart Type
There are three available chart types: Standard, Histogram, and Scatter charts.
2. General tab
Use the General tab select data column names for axis or series designation from the referenced database table. Data records can be selected for inclusion in the chart by clicking a button and selecting the desired column name.
-
-
X-axis - Use to specify the data columns to be used as units and labels for the x-axis (e.g., Time_Period or Name output column).
-
Y-axis - Use to specify the data to be displayed as values for the selected series using the first y-axis (e.g., Price or Cost output columns).
-
Grouping Data - Formerly called Series, use to specify the fields to be used for chart series or grouping (e.g., Name, Condition, and/or Run_ID output columns).
-
Second Y-axis - Use to specify the data to be displayed as values for the selected series using the secondary y-axis (if applicable).
-
Shortcuts for General Tab
- In the Select Columns box, begin typing to jump in the list to the desired column. Use the space bar to select the highlighted column, and then Enter to close the box.
- To delete a selected column from the General window, highlight the column name and press Delete or double-click on a column name.
- To move a selected column from one box to another, click and drag the column name to the desired location. Note that this makes a copy, so use one of the methods above to then delete the column from the original location.
The Axes and Fonts tabs are used to easily access the most common display options like changing the axis range or font styles for titles and labels.
![]() Productivity Tools
Productivity Tools
![]() Chart Setup
Chart Setup