Column Fill Examples
Example 1
The following steps show you how to add price results from the Zone tables and resource results from Resource tables – tied together through common zone and time period data.
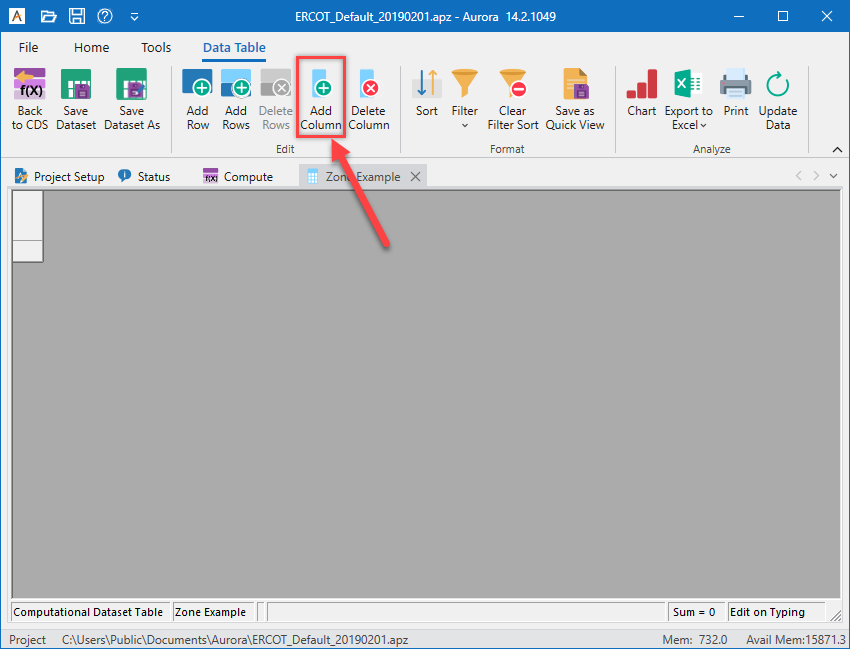
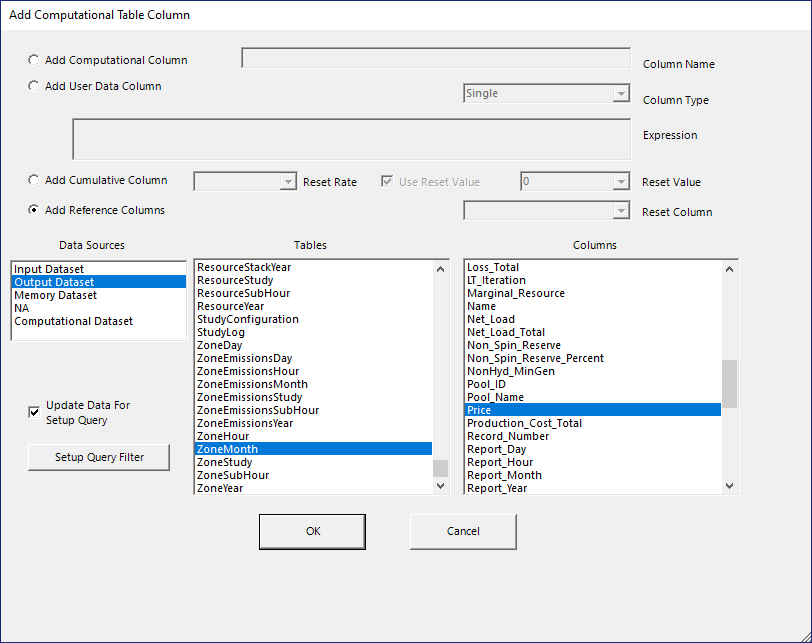
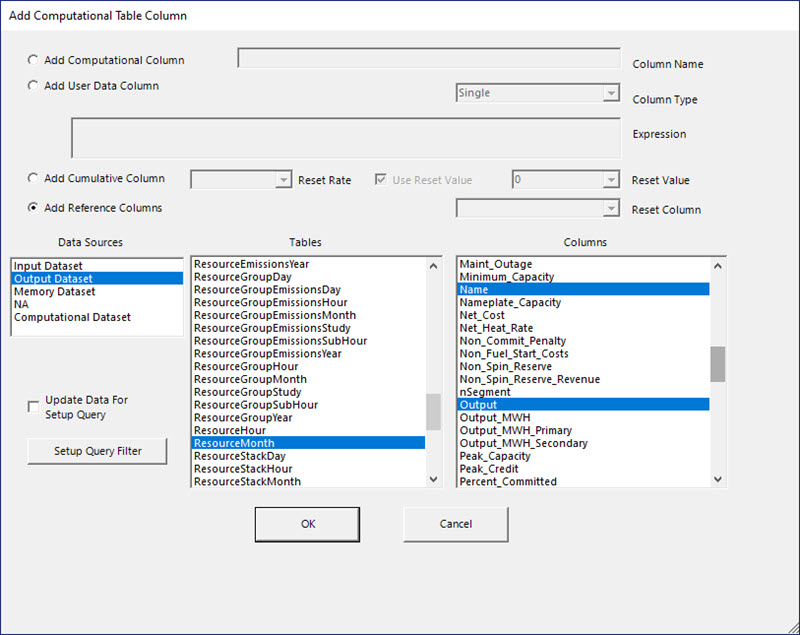
- Click Add Column button.
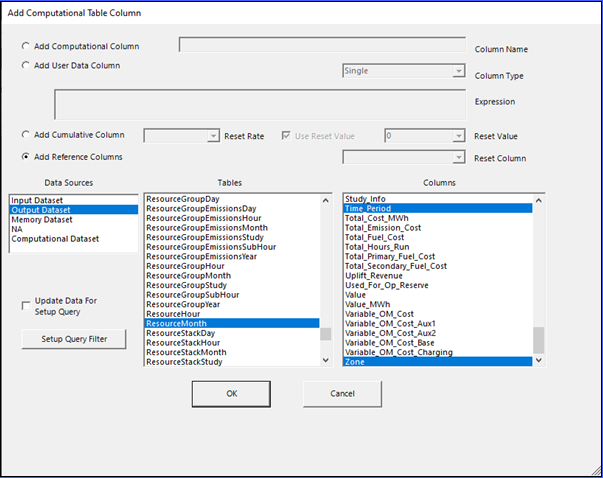
- Select the Data Sources > Output Dataset, under Tables select ResourceMonth, and under Columns select:
- ID
- Name
- Output
- Time_Period
- Zone
- Click OK.
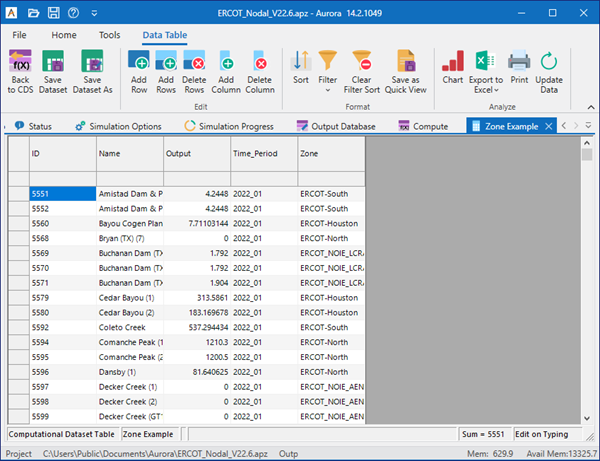
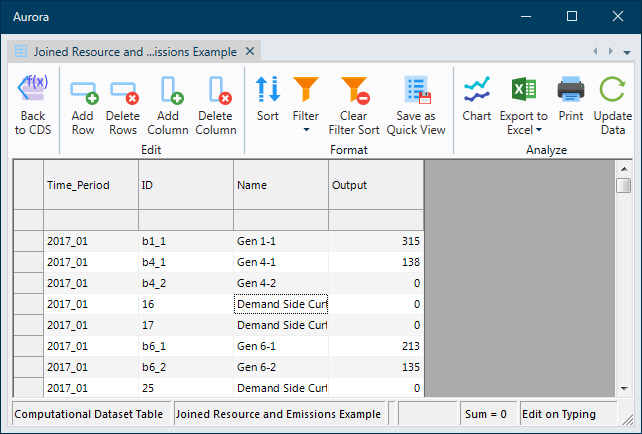
Your table should now contain the desired columns from the ResourceMonth output table:
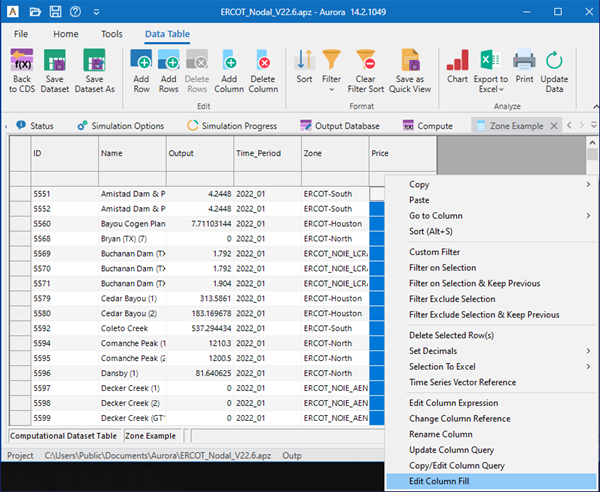
- Next, add the Price column from the ZoneMonth output table:
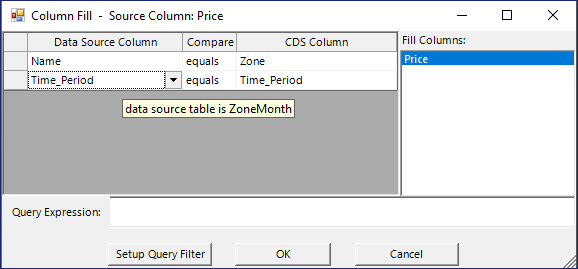
- Now that you have the Price column, select Edit Column Fill from the right-click dropdown menu to load the Column Fill window.
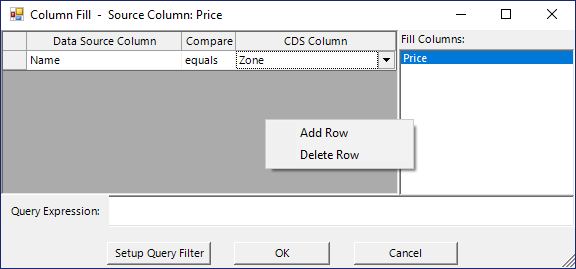
- Select Name from the Data Source Column dropdown and Zone from the CDS Column dropdown.
- Right-click on the grey area, and then select Add Row.
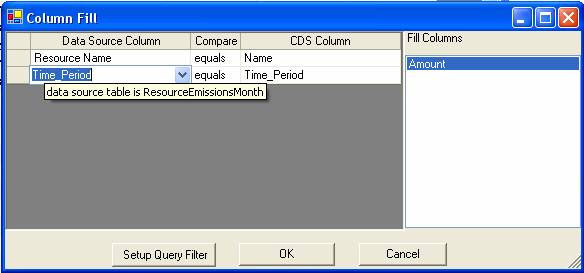
- Select Time_Period from the DataSource Column and the Time_Period Column:
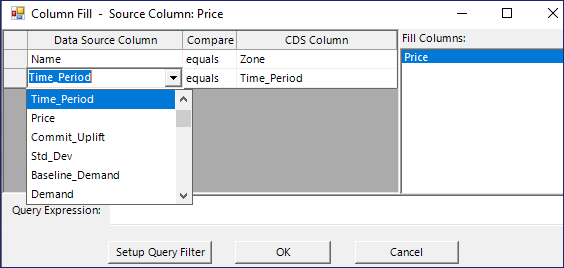
- By hovering the mouse over the Data Source Column a hot tip will appear telling us the data source table of the column. Also select the Price column in the Fill Columns list box. This will apply the fill to the Price column.
- Click OK.
We now have our ID, Name Time_period and Zone data from the ResourceMonth table and our corresponding Price Data from the ZoneMonth table:
Example 2
Adding Amount results from the resource emission tables and resource results from resource tables – tied together through common resource name and time period data.
1. Click the Add Column button.
2. Select Output Dataset from Data Sources.
3. Tables > ResourceMonth and the Columns > ID, Name, Time_Period and Output columns then hit OK.
Your table should now contain the desired columns from the ResourceMonth output table:
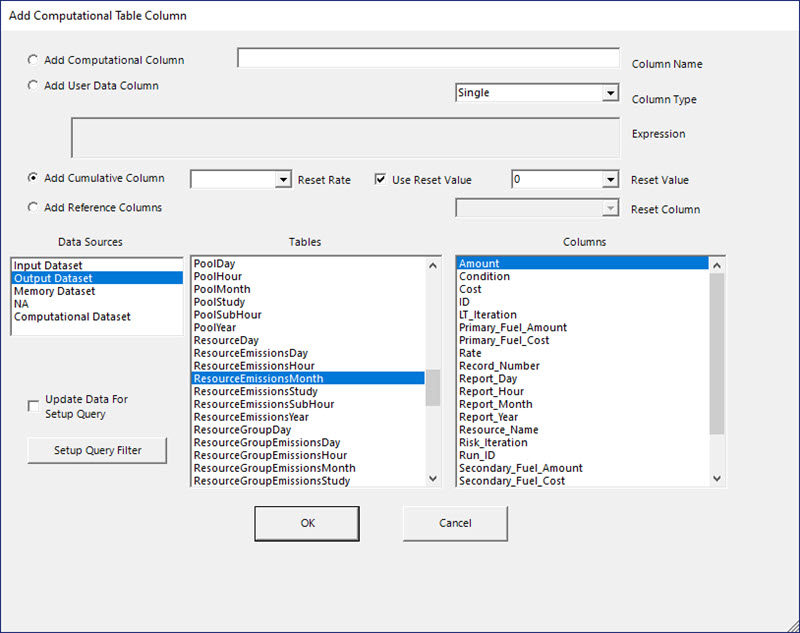
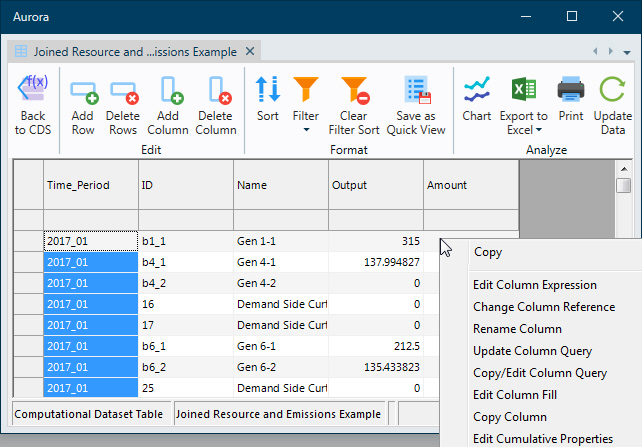
- Next add the Amount column from the ResourceEmissionsMonth output table.
- Now that you have the Amount column, select Edit Column Fill from the right-click dropdown menu to load the Column Fill window.
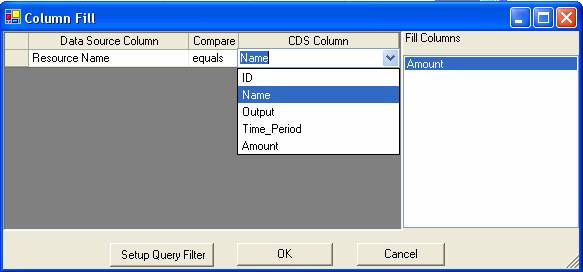
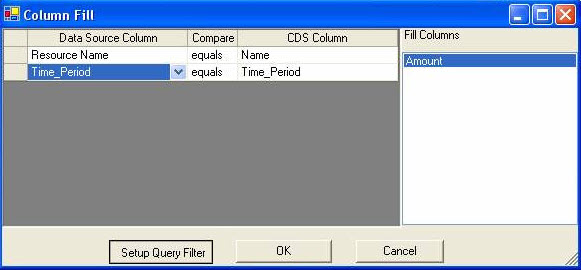
- Select Resource Name from the Data Source Column dropdown and Name from the CDS Column dropdown.
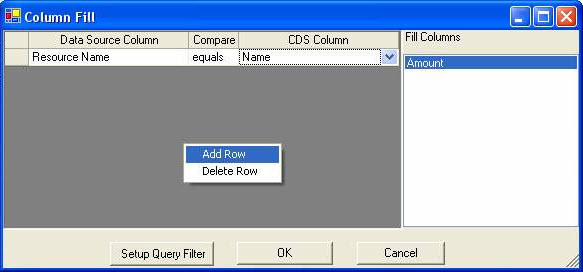
- Right-click and then select Add Row.
- Select Time_Period from the DataSource column and the Time_Period column.
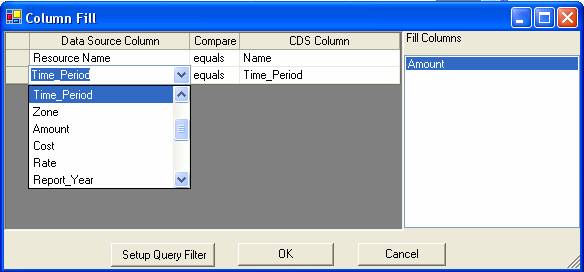
- Hover your mouse over the Data Source Column to see a hot tip telling you that the data source table of the column is ResourceEmissionsMonth.
- Select the Amount column in the Fill Columns List Box. This will apply the fill to the Amount column.
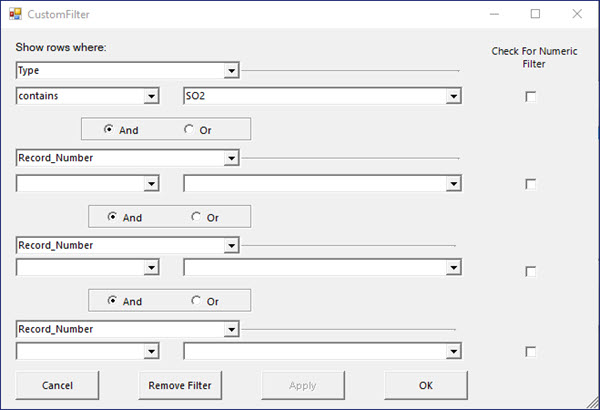
- Click the Setup Query Filter button to set a filter on the data pulled into the Amount column.
- This brings up the CustomFilter dialog. Here we select the Type column and set the filter to contain S02. Then hit OK.
- Next hit OK on the Column Fill window to apply the fill.
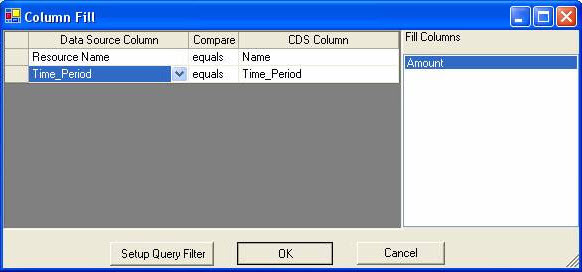
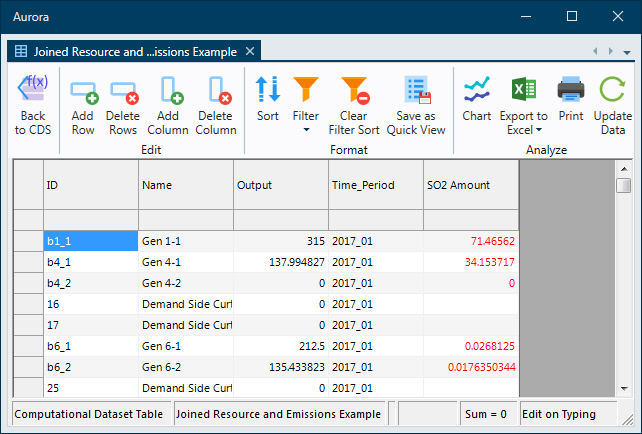
We now have our ID, Name, Output and Time_Period data from the ResourceMonth table and our corresponding Amount Data from the ResourceEmissionMonth table. Notice we have also renamed the column Amount to S02 Amount: