Market Quantity
| Units: | ~ |
| Mode: | Input Only |
| Multi-band: | True |
| Default Value: | 0 |
| Validation Rule: | Any Value |
| Key Property: | No |
| Description: | Quantity point in market demand function |
Market Quantity sets the quantity part of the market supply/demand function when modelling a market with depth i.e. a market where the volume of sales or purchases affects the price received/paid. Quantity is used in pairs identified by band number with the Price property. The Base Quantity defines the cross-over point between selling into the market and buying as explained in the following example.
| Property | Value | Units | Band |
| Price | 56.03 | - | 1 |
| Quantity | 150 | - | 1 |
| Price | 44.62 | - | 2 |
| Quantity | 250 | - | 2 |
| Price | 33.22 | - | 3 |
| Quantity | 350 | - | 3 |
| Base Quantity | 250 | - | 1 |
This example defines the demand function shown in Figure 1. The Base
Quantity sets the reference point separating sales (above) from
purchases (below). The highest Quantity point forms an upper bound on
sales into the market i.e. the maximum sales is the highest
Quantity less Base Quantity.
Likewise the maximum purchases from the market is set by Base
Quantity less the lowest Quantity point. These bounds can be
overridden using the Max Sales and
Max Purchases properties.
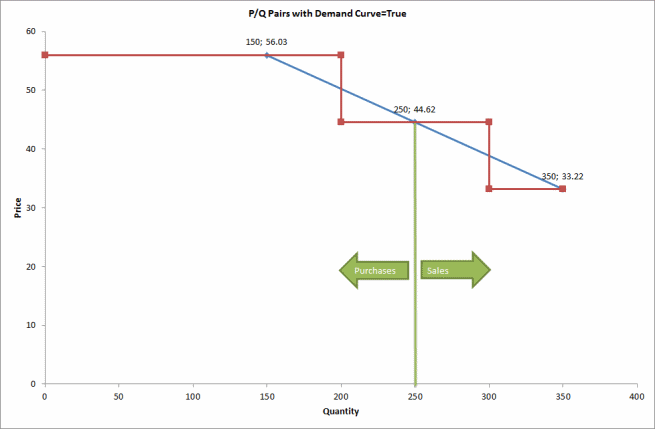
Figure 1: Market Supply/Demand Function
Notice how the P/Q pairs are interpreted as points on a demand
curve, and a step function is fitted through them automatically. You
can control the step function directly by setting the Demand
Curve property to false. This would result in the step
function shown in Figure 2.
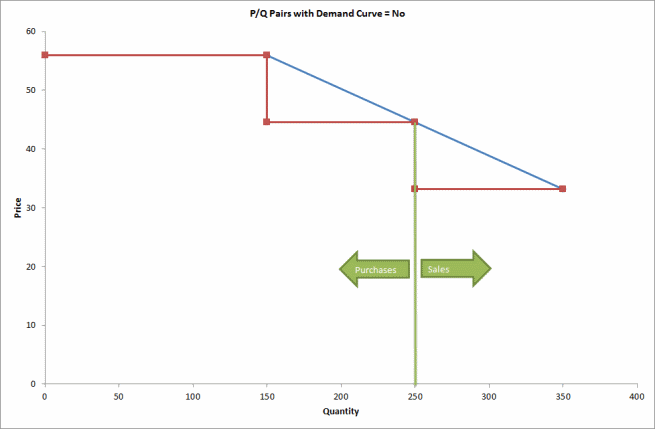
Figure 2: Market Supply/Demand Function with Demand Curve = False