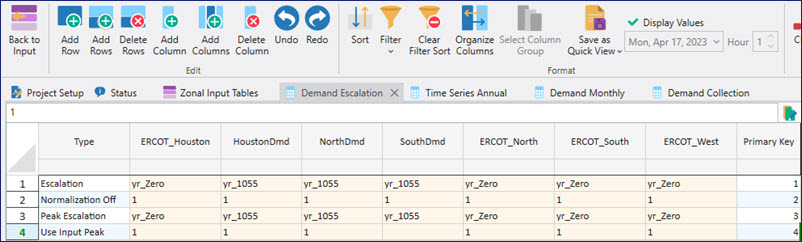
Demand Escalation Table
The Demand Escalation table contains the demand growth applied to the demand by area. The table is also used to optionally set a flag which removes the option to normalize the load for specified areas. This feature is useful to model actual hourly load for a specific area and year.
The value entered in Escalation or Peak Escalation rows typically references a record in the Time Series Annual table. This reference begins with yr_ and is followed by the record ID in the Time Series Annual table which specifies the annual escalation of demand (in percent) for each of the demand areas. Example: The annual vector for the area isoNE_MassSE (below) is "yr_DmdEsc_SEMA" which is a reference to a record in the Time Series Annual table named DmdEsc_SEMA.
See the Type column for an explanation of each row in this table.
Escalation of Demand Formula
One plus the escalation (for a year) is multiplied times the average demand (for the same year as the escalation) to get the average demand for the following year. The resolved values are in percent (e.g., an entry of 1.5 represents a value of 1.5%).
Normalization of Demand
The Demand Escalation table contains an optional row that is used to indicate whether or not normalization of demand will be applied to individual areas. If this row is not included, normalization of demand will be applied to all areas. Learn more...
|
COLUMNS INCLUDE |
||
![]() Demand Escalation Table
Demand Escalation Table