Demand Monthly Table
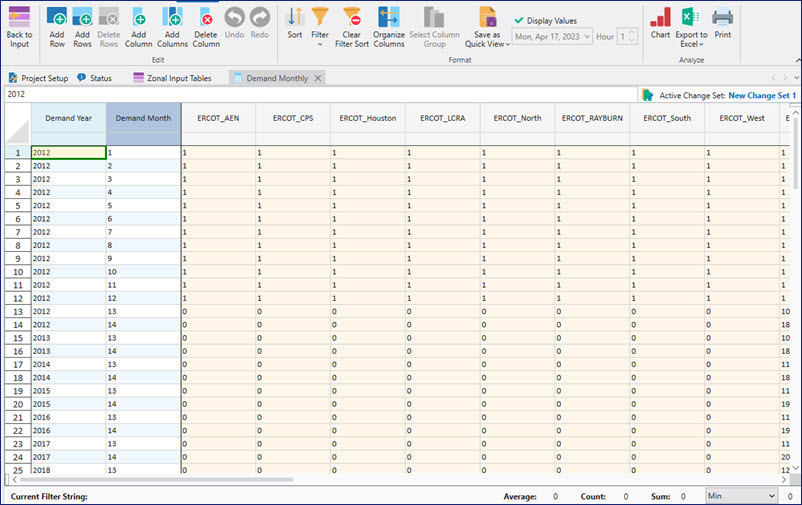
The Demand Monthly table specifies the monthly demand shape and annual average demand by area. Rows 1-12 specify monthly demand as a percentage of the annual average. Row 13 is the annual average energy for the area and is defined in average MW. The monthly demand shapes should average to 1.0 and when multiplied by the annual average energy and the hourly demand (as specified in the Demand Hourly table) they determine the hourly energy demand for each area.
Rows 14-16 are optional and only used when the Use annual peak and energy demand inputs check box is selected, located in the Dispatch and Demand folder of Simulation Options.
- Row 14 defines a peak to be applied to the normalized shape found in the Demand Hourly table and is defined in MW.
- Row 15 defines the annual total energy to be applied to the normalized shape found in the Demand Hourly table and is defined in GWh. If row 15 is not found, row 13 will be used to define the annual average energy (in average MW) to be applied to the normalized shape found in the Demand Hourly table.
- Row 16 is used when Peak Shaping Method = Control Min and defines the minimum value for the demand base year, in the same manner that the peak is specified in row 14. If row 16 is not present, Aurora will calculate the default base year minimum using the hourly shape, peak, and energy values.
![]() NOTE: If running a Long-Term Optimization study, the 13th row must contain the annual average demand for the area.
NOTE: If running a Long-Term Optimization study, the 13th row must contain the annual average demand for the area.
|
COLUMNS INCLUDE |
|||
![]() Demand Monthly Table
Demand Monthly Table