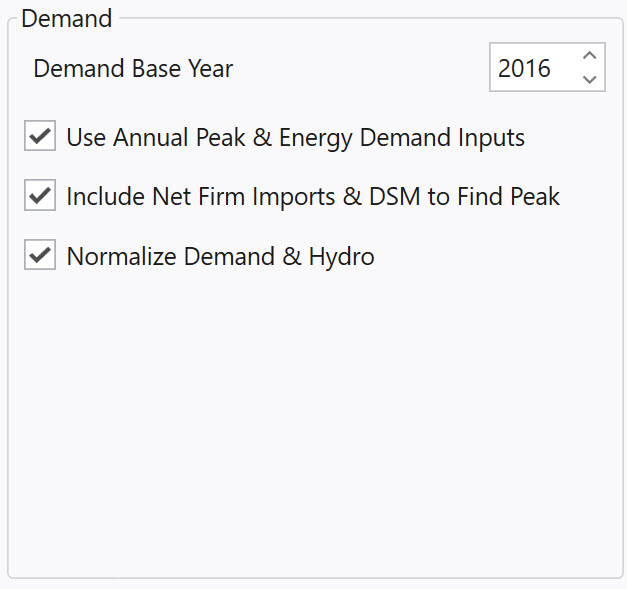
Use Annual Peak and Energy Demand Inputs
Check this box for demand to be shaped by adjusting the defined normalized shape found in the Demand Hourly table and applying a peak found in (optional) row 14 and annual average found in row 13 or the annual total demand found in (optional) row 15 of the Demand Monthly table.
When this methodology is used to calculate demand, all other monthly demand shapes (rows 1-12 in Demand Monthly table) are ignored.
Rows 14 and 15 are only used when the Use Annual Peak and Energy Demand Inputs option is selected. Row 14 defines a peak to be applied to the normalized shape found in the Demand Hourly table (in MW). Row 15 defines the annual total energy to be applied to the normalized shape found in the Demand Hourly table (in GWh). If row 15 is not found, row 13 will be used to define the annual average energy to be applied to the normalized shape found in the Demand Hourly table (in average MW). The Type column of the Demand Escalation table defines how this data is applied.
The Use Annual Peak and Energy Demand Inputs option can be applied to specific demand areas or all demand areas in the system. This is achieved by setting the Use Input Peak option in the Type column of the Demand Escalation table.
![]() NOTE: The logic describe in Demand Escalation Table will apply if the Type column is not present.
NOTE: The logic describe in Demand Escalation Table will apply if the Type column is not present.
Peak & Energy Demand Input Methodology
The Use Annual Peak and Energy Demand Inputs option allows the user to separately input and control growth rates for annual peak demand and average annual or energy demand for every area and every year. Since the hourly shape input for a year may not agree precisely with these user-specified peak and energy values, Aurora uses an algorithm to adjust the hourly demand shape data from the Demand Hourly table in order to produce a new demand shape which will produce both the targeted peak and energy values for every area. The following is a description of the method used:
-
Raw data from the Demand Hourly table is used to create a vector of hourly demand ratios or shapes for the year. This series of hourly shapes is calculated based directly on the hourly data for the appropriate year and is equal to (hourly demand) / (annual average demand). Denote these hourly shapes calculated directly from the input data as Shapebase,h. This vector will have an average of one.
-
Denote the desired peak demand (as calculated from Row 14 in the Demand Monthly table and applying the appropriate demand escalation rate) as Peaknew and the desired average demand (as calculated from Row 15 in the Demand Monthly table and using the appropriate demand escalation rate) as Average_Energynew.
-
Denote the original peak demand based directly on the input hourly data as Peakbase and the average of the input hourly demand as Average_Energybase.
-
The “Peak Ratio Change” is calculated using the absolute values of the ratio of the target peak to the target energy and the ratio of the base peak to the base energy:
Peak Ratio Change = |1- (Peaknew / Average_Energynew)|/|1- (Peakbase/ Average_Energybase)| -
The vector of base hourly demand shapes calculated in Step 1 above is then adjusted by the following equation to produce a new set of hourly shape factors which, when applied to the new average, will produce the target peak and target energy values:
Shapenew,h = 1-(1-Shapebase,h)*Peak Ratio Change -
The new hourly demand values for the year are calculated as:
Demandnew,h= Shapenew,h*Average_Energynew
![]() Use Annual Peak and Energy Demand Inputs
Use Annual Peak and Energy Demand Inputs