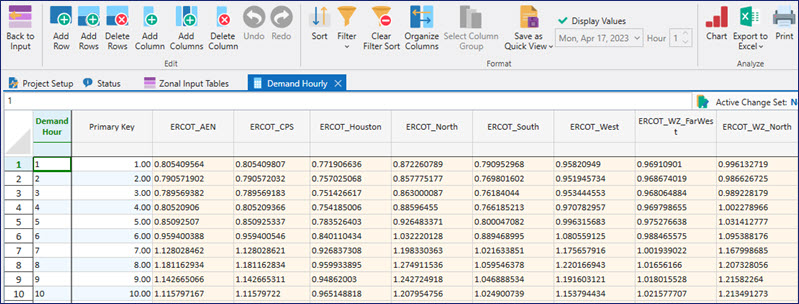
Demand Hourly Table
The Demand Hourly table contains hourly load factors for an annual period (8760 + 8 days). Each column is named or numbered and is referenced by an area or portfolio entity. The load data contains an extra 192 hours (8 days). This allows for indexing to the correct beginning day of week for any year specified (including leap years). The data in this table begins with Hour 1 of a Monday and ends with Hour 24 of a Tuesday. Weeks in Aurora are Monday – Sunday.
Aurora can automatically normalize the hourly demand factors so that the average of the demand factors for the hours being dispatched in a month or year always equals 1.0. Monthly normalization is controlled using Normalize demand and hydro switch in the Dispatch and Demand folder of Simulation Options. Annual normalization is controlled using Use annual peak and energy demand inputs in the Dispatch and Demand folder of Simulation Options. These options are mutually exclusive. Furthermore, while these switches are applied globally to all areas, they can be effectively switched off for select areas via optional rows in the Demand Escalation table.
![]() NOTE: Columns in this table cannot reference Computational Datasets for input.
NOTE: Columns in this table cannot reference Computational Datasets for input.
|
COLUMNS INCLUDE |
|||
![]() Demand Hourly Table
Demand Hourly Table