Type Column
Column Type = Text (Dropdown Menu)
Use this column with the Normalize Demand and Hydro and Use Annual Peak and Energy Demand Inputs logic checkboxes located in the Dispatch and Demand folder under Simulation Options.
This column is required when using names (instead of numbers) in the Number column. This column is not required when only using numbers in the Number column. If this column is NOT included, the data will be used for Escalation as described below. Otherwise, this column contains a dropdown menu with the following options:
-
Escalation
This is the default row in the Demand Escalation table. This row contains the Annual Vector whi,ch references the growth applied to demand by area.
![]() NOTE: The value entered in a row must reference a record in the Time Series Annual Table, which specifies the annual escalation of demand (in percent) for each demand set. See Entering a Time Series for more information.
NOTE: The value entered in a row must reference a record in the Time Series Annual Table, which specifies the annual escalation of demand (in percent) for each demand set. See Entering a Time Series for more information.
The Use annual peak and energy demand inputs logic switch should be selected for the following:
-
Normalization Off
Use this optional row with Normalization of Demand to set a flag that determines if normalization of demand will NOT be applied for individual areas. (This is the normalization of hourly factors across the month.) Enter one (1) in the field to indicate that normalization of demand will NOT occur for that area. Any value other than one (zero or blank) in these cells indicates that normalization of demand will take place for the areas. -
Peak Escalation
This optional row defines the peak demand growth rate applied to the input peak when the Use peak and energy demand inputs logic check box is selected. If used, this column defines how the data in rows 14 and 15 of the Demand Monthly table are applied.
![]() NOTE: The value entered in a row must reference a record in the Time Series Annual Table, which specifies the annual escalation of demand (in percent) for each demand area. See Entering a Time Series for more information.
NOTE: The value entered in a row must reference a record in the Time Series Annual Table, which specifies the annual escalation of demand (in percent) for each demand area. See Entering a Time Series for more information.
-
Use Input Peak
This optional row contains a flag that specifies if peak and energy demand inputs will be applied to the specified demand area (apply by selecting the Use annual peak and energy demand inputs logic check box). -
-
Enter TRUE or a one (1) to indicate the specified peak (row 14 of the Demand Monthly table for the specified column will be used). This option overrides the Normalization Off input and ensures the peak is met.
-
Enter FALSE or a zero (0) to indicate the peak will not be used (row 14 of the Demand Monthly table for the specified column will be ignored). The Normalization Off input is applied.
-
Enter two (2) to use the monthly averages from the Demand Monthly table and the input annual peak (row 14 of the Demand Monthly table) to shape the load for the demand set. If the demand set also has peak or average monthly values specified directly in the Demand Monthly Peak table, the value in that table will take precedence. For a detailed description of the logic, click herehere.
Using input annual peak and monthly averages
First Aurora calculates the annual demand in MWa. This is not done by simply taking the value in row 13 and applying escalation. To calculate the expected annual demand correctly, the model must take into account the annual value as well as each of the monthly values, which it does, weighting them properly by how many days are in each month. Once that expected annual demand is found (with escalation applied), the input hourly shape is adjusted to account for the monthly averages, and then the standard peak and energy logic is used to get an 8760/8784 shape for the year which meets the peak and has the right average.
The model then determines what the max demand value for each month is based upon that hourly shape for the year.
It then discards the hourly shape for the year and calculates a new shape for each month based upon the input average energy for the month and the calculated peak demand from the previous step.
-
![]() NOTE: If the Use annual peak and energy demand inputs logic check box is not selected, this row is ignored. If this row missing the default is TRUE and the peak specified in row 14 of the Demand Monthly table will be used for all demand areas.
NOTE: If the Use annual peak and energy demand inputs logic check box is not selected, this row is ignored. If this row missing the default is TRUE and the peak specified in row 14 of the Demand Monthly table will be used for all demand areas.
-
Peak Shaping Method
This optional row is used to select what type of algorithm will be used to shape demand. All methods use an underlying input shape, a peak value, and an average value to determine a final demand curve that hits the peak, has the right average, and stays true to the underlying shape. Each method honors peak and energy inputs but result in slightly different shapes (i.e., load factor is constant). -
-
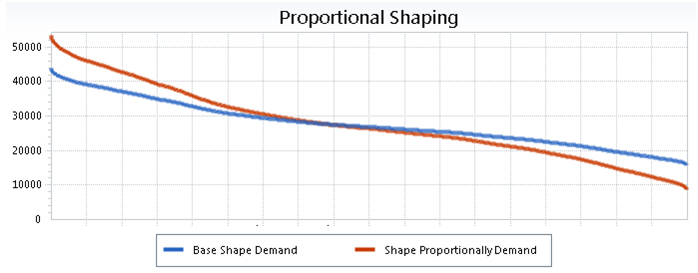
Shape Proportionally is the default method used to meet the peak. This simple method uses an algorithm that ensures every hour from the original shape moves similarly, i.e., the minimum is moved down the same way the peak is pulled up. When the peak gets too high, this method occasionally pushes the minimum down, potentially to zero. The next two methods can be used so that the bottom part of the curve does not move down like the top part of the curve moves up.
-
-
-
-
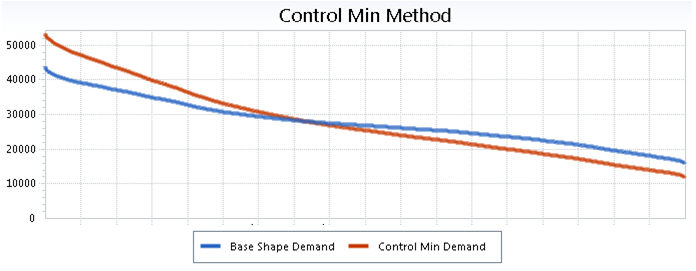
Control Min takes as input a peak, average, and minimum value, and this algorithm uses a quadratic program to minimize the deviation from the underlying shape given the constraints of hitting the min, average, and maximum.
-
-
-
-
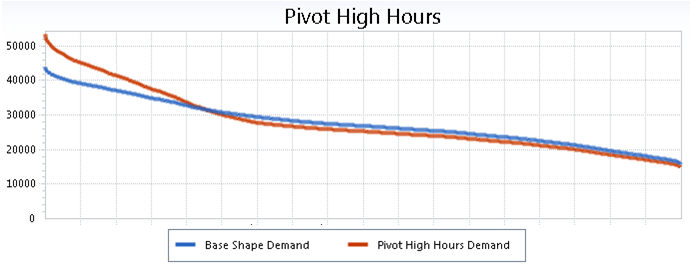
Pivot High Hours takes as input a percent value (the default being 66.67%) to determine at what point to pivot the curve. This algorithm uses an iterative approach to converge upon the peak and the average. Essentially, it takes all hours above the pivot point and shapes them in the same way to meet the maximum value, re-normalizes the curve to get the average, shapes the top hours again to get the maximum, etc.
-
-
Comparison of Methods
**Note that lowest demand hours have biggest differences
-
Peak Shaping Parameter
Use this optional row with the Peak Shaping Method above. It is used to define the annual escalation of the minimum demand level (Peak Shaping Method = Control Min) or a pivot point (Peak Shaping Method = Pivot High Hours; the value must be somewhere between 50 and 90). -
Hourly Shape
Use this optional row to determine an hourly shape for the demand set. The Hourly Shape can be any time series, but it should generally be an hourly vector. When populated for a given demand set, the Demand Hourly table will not be used to determine the hourly level data for the set.
![]() NOTE: The value entered in a row must be a time series reference, typically to a record in the Time Series Hourly Table which specifies the hourly shape for the demand set. See Entering a Time Series for more information.
NOTE: The value entered in a row must be a time series reference, typically to a record in the Time Series Hourly Table which specifies the hourly shape for the demand set. See Entering a Time Series for more information.
Enter a comma-delimited list of hourly vectors to average multiple time series references together. For example, enter a list of hourly references to create a single normalized shape from the last five years of historical data. Aurora will create a new shape by averaging them together.
To use a time series hourly reference from a single data year, e.g., 2016, to determine the shape for multiple future years, the reference should be specified with “|DOW” at the end, e.g., hr_WindShape|ERCOTWest|2018|DOW. The Demand Hourly table is no longer required if this method is used.
![]() Type Column
Type Column