Demand Monthly Peak Table
This optional table allows greater control over demand shapes by specifying demand peaks (in MW) and average demand (in average MW or GWh) for any given area by month. The methodology is designed to mirror the methodology used with the Use annual peak and energy demand inputs logic switch (located in the Dispatch and Demand folder of Simulation Options), However, use of this table allows specification of peak and energy on a monthly level. This capability overlays Aurora’s existing demand logic so it can be used in conjunction with standard demand or with an annual peak also specified using the Demand Monthly input table.
For each month where data in this table is specified for an area being run, this data and method will be applied. For any months run where the data is missing, Aurora will default to the active demand method in the run. See Use annual peak and energy demand inputs for a description of the algorithm that ‘stretches’ or ‘compresses’ demand shapes to achieve specified peaks. Unlike the Use annual peak and energy demand inputs logic switch, there is no corresponding logic switch to specify monthly peaks and averages.
The monthly peak logic is activated by selecting the check box in the In Study column in the data grid of the Input Tables Window. The Database Table Name can be anything, as long as it does not include special characters.
|
COLUMNS INCLUDE |
|||
![]() NOTE: Like all other demand tables, this table is included in Aurora’s multiplicative demand table structure. However, use of this table will bypass both the Demand Escalation table and the annual average demand specified in row 13 of the Demand Monthly table for any month and year specified.
NOTE: Like all other demand tables, this table is included in Aurora’s multiplicative demand table structure. However, use of this table will bypass both the Demand Escalation table and the annual average demand specified in row 13 of the Demand Monthly table for any month and year specified.
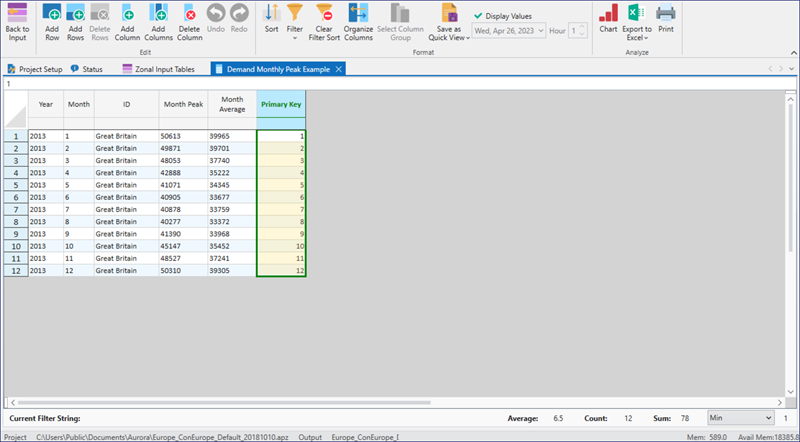
In the example table above, if Aurora were run from January 2005 through December 2006, the monthly averages and peaks for November and December 2005, and May and July 2006 would be used as specified directly in this table. The monthly averages and peaks for all other months would come from the normal multiplicative method, which does use the Demand Escalation table and the annual average demand specified in row 13 of the Demand Monthly table.
![]() NOTE: Use of this method can create discontinuities at the monthly transitions. These may be significant if peaks are very extreme. This can be important for users who partially populate this table for some months and then transition back to the standard demand method for the remainder of the study.
NOTE: Use of this method can create discontinuities at the monthly transitions. These may be significant if peaks are very extreme. This can be important for users who partially populate this table for some months and then transition back to the standard demand method for the remainder of the study.
Examples of situations when these discontinuities are noticeable may include the following:
-
Monthly boundaries that transition from weekend to a weekday or vice versa. For example, June 30, 2006 is a Friday (with on-peak hours) and July 1, 2006 is a Saturday (generally without on-peak hours). Again, if peaks are appropriately chosen, monthly transitions should not be significant.
-
If the annual peak logic is selected (using the Use annual peak and energy demand inputs logic switch) and the corresponding row 14 of the Demand Monthly table is NOT used AND no monthly shape factors are specified in rows 1-12 of the Demand Monthly table (defaults remain at 1). In other words, if the user specifies appropriate monthly shape factors and does not wish to specify an annual peak, then the monthly transitions should not be significant.
![]() NOTE: Hourly demand that is directly input through the Hourly Demand Vector column of the Areas table will bypass the multiplicative demand table structure and override this monthly peak logic.
NOTE: Hourly demand that is directly input through the Hourly Demand Vector column of the Areas table will bypass the multiplicative demand table structure and override this monthly peak logic.
![]() Demand Monthly Peak Table
Demand Monthly Peak Table