Pivot Tables
Aurora pivot tables can be created directly from output data. These user-friendly tables are similar to those in Microsoft Excel™ in terms of construction, formatting and use. You can extensively customize Pivot Tables for reporting and organization of output data.
After construction, the tables can easily be saved for reuse as Quick Views. You can use Pivot tables with all output database formats and they are designed to work with tables resulting from Output Queries.
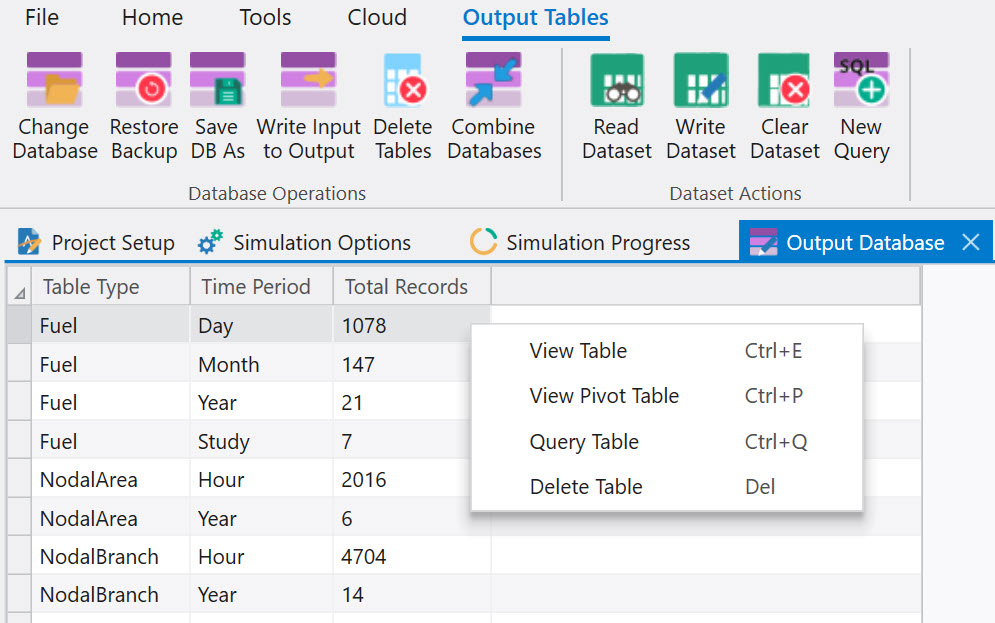
To create a pivot table, right-click on a table from the Output Tables window and choose “View Pivot Table”.
This will bring up a Pivot Table Designer window like the one shown below.
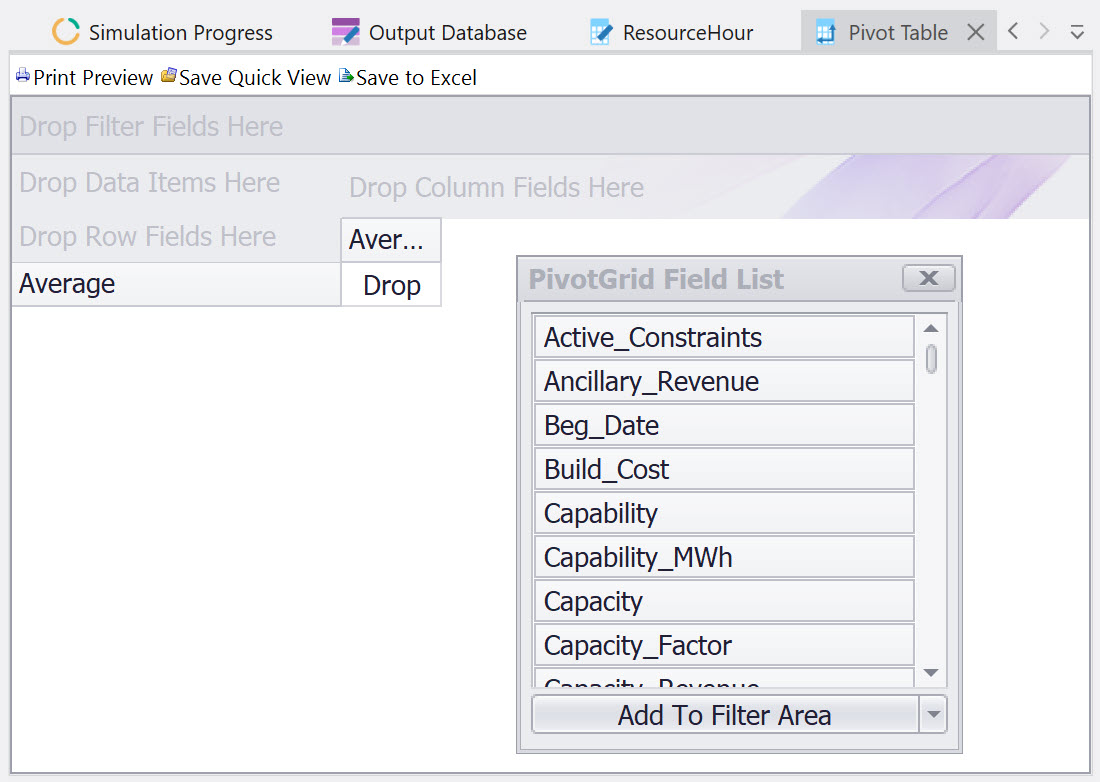
The window for the PivotGrid Field List will hold all columns present in the output table. Select a field from the list and drag it to the desired position/function. Options include Filter, Row, Column and Data fields. The fields can also easily be moved from one function to another. Customization of the grid appearance is possible through a right-click menu, as well as specification of statistics method used in the total columns and rows.
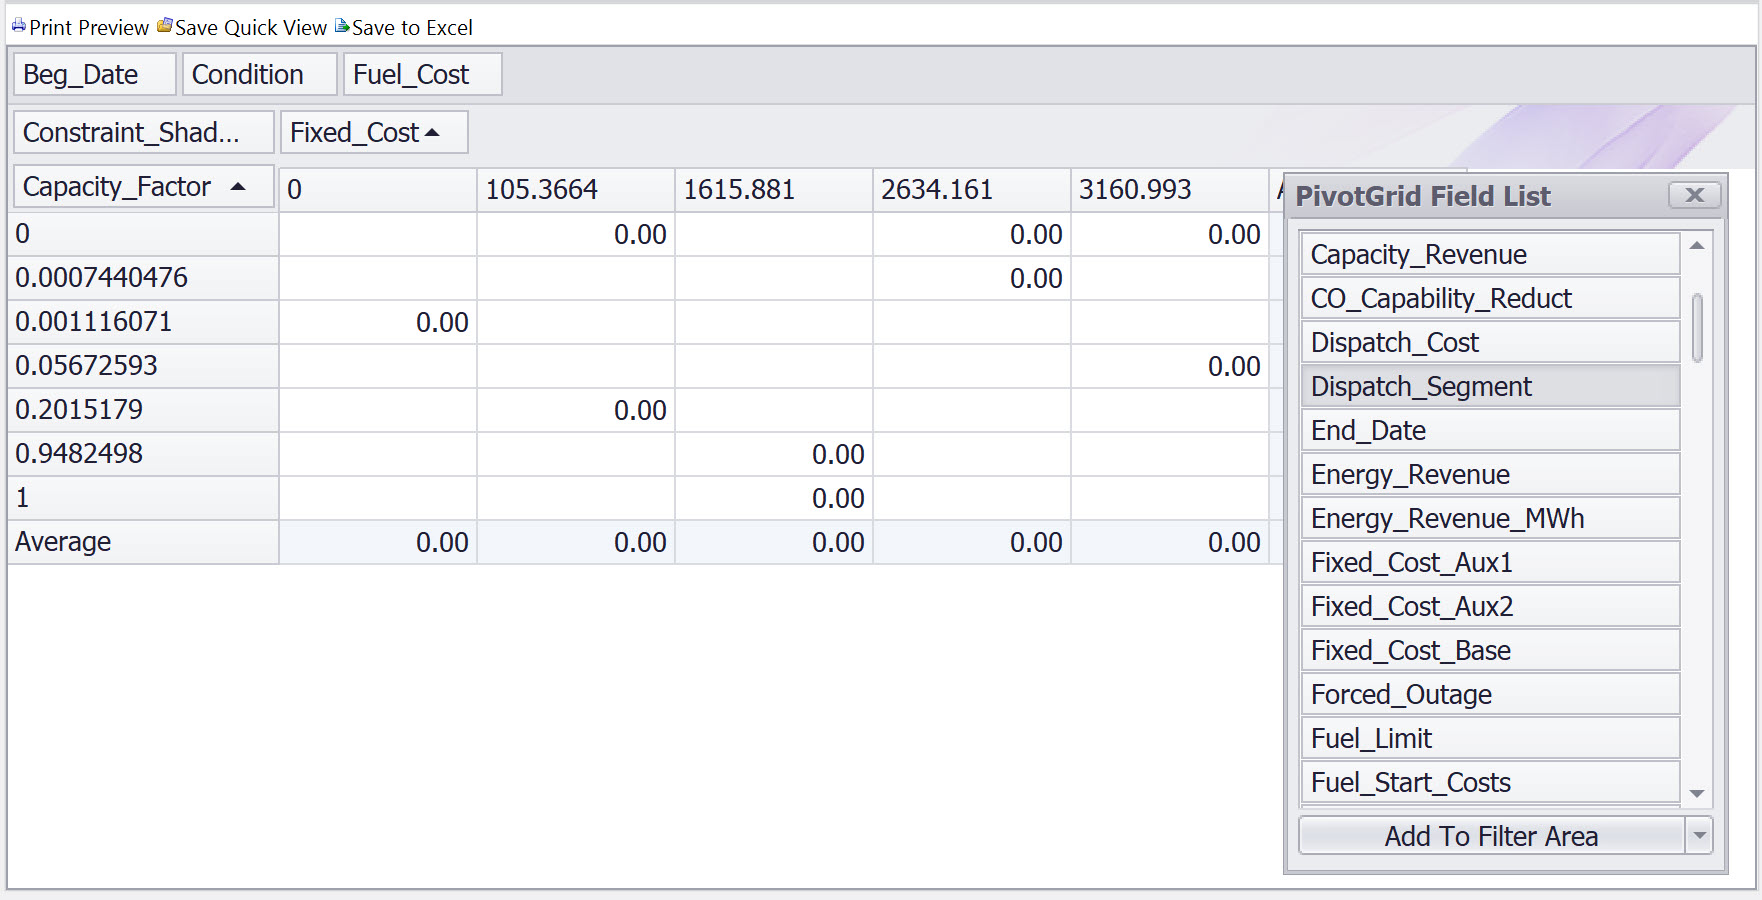
When the pivot table layout and format is satisfactory, use the Save Quick View button to save the pivot table layout as a Quick View. The pivot table will then appear under the “Pivot Quick Views” section of the Quick View and will be saved in the selected template/Quick View file. See Using Quick Views for more information.
![]() Productivity Tools
Productivity Tools
![]() Pivot Tables
Pivot Tables