Aurora Home Tab
The Aurora Home Tab ribbon provides quick access to the most frequently used functions. The ribbon toolbar is divided into five groups: Simulation Control, Data, Visualizations, and Information. Don't forget to also review the Tools ribbon tab information.

Simulation Control
|
|
Project SetupThis button activates the Project Setup window. Use this window to set the Study Type, Study Period, Output Database, and Study Cases. This window cannot be closed while a project is open, and the button provides quick access to the window and its settings. |
|
|
Simulation OptionsThis button opens the Simulation Options window. Use this window to access to define the contents and scope of a project file, including study type/options, logic settings, and output reporting. |
|
|
RunThis button launches the current run as defined in Project Setup and Simulation Options. |
StepThis button causes Aurora to run for one dispatch hour and then pause. This is useful if you wish to examine the detailed hourly operation of the model available in the Memory Tables. The run can be continued by clicking the Run button.
|
|
|
|
PauseThis button pauses an Aurora simulation in progress. The run pauses after the completion of an hour and the user may examine information in the Memory Tables for the hour. Output data is also available and is calculated up to and including the current hour. The run can then be continued by clicking the Run or Step buttons. |
|
|
StopThis button will stop an Aurora simulation in progress. Use the button if you need to stop and restart a run. If a run is stopped, current output data is not written to the output database. It can be written after the run is stopped using the Write Dataset button on the Output Database Tables window.
The stop button can also be used to break out of loading a large input database or Change Set file (.csf) when loading a project file. |
|
|
Simulation ProgressThis button opens, or brings into view, the Simulation Progress window which provides a dashboard for various items documenting the progress of the simulation during a run. |
Scenarios
|
|
Change SetsThis button opens the Change Sets window, which is used to create and manage change sets which represent an incremental set of data changes to the underlying database. |
|
|
Parameter SetsThis button opens the Parameter Sets window, which is used to create and save multiple combinations of Simulation Option settings within a single Aurora project. |
Data
|
|
Zonal InputThis button opens the Zonal Input Data Window, which is used to access, modify, organize and manage all of the zonal input data used in an Aurora study. |
|
|
Nodal InputThis button opens the Nodal Input Data Window, which is used to access, modify, organize and manage all of the nodal input data, including network case or loadflow files, used in an Aurora study. |
|
|
OutputThis button opens the Output Tables, which is used to access the output tables as well as options for the viewing, printing and charting of output tables. |
|
|
CDSThis button opens the Computational Dataset (CDS) capability, which is used to further customize data. CDSs are user-constructed tables that reference columns from input, output, memory, and other CDS tables, as well as columns that contain expressions or other data created by the user. Expressions can reference other columns in the CDS table and utilize math, comparisons, functions and aggregation, while queries and fills may also be applied when retrieving data from other datasets. |
Visualizations
Zonal SystemThis button will open the Zonal System Diagram. This system diagram provides a graphical representation of the system being modeled with displays of either input data or output results through time. See System Diagram for more information. |
|
|
|
Nodal SystemThis button will open the Nonal System Diagram. This system diagram provides a graphical representation of the system being modeled with displays of either input data or output results through time. See System Diagram for more information. |
|
|
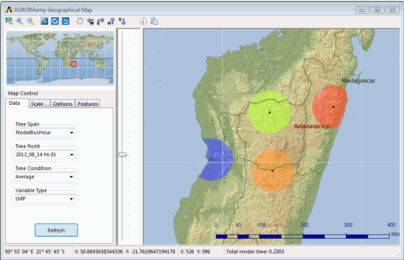
GISThis button opens the nodal Geographical Map which is used to view locational pricing and other information. Click to enlarge image:
|
|
|
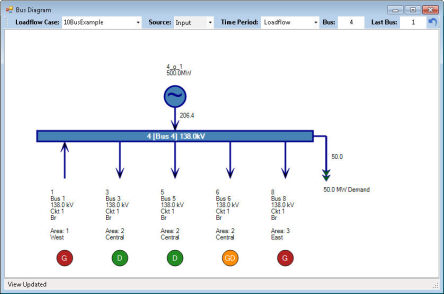
Bus DiagramThis button opens the nodal Bus Diagram, a graphical representation of the nodal system being modeled.
Click to enlarge image:
|
Information
|
|
StatusThis button opens, or brings into view, Status window, which provides important information about the current operation of Aurora. |
|
|
Quick ViewsThis button opens the Quick View Manager window, which provides options for editing and automating the use of Quick Views. |
|
|
HelpThis button opens the Help system which provides immediate access to assistance on all of the features and functions of Aurora. It provides definitions, explanations, knowledge base articles, and tutorials for using Aurora. |
![]() Aurora Home Tab
Aurora Home Tab


