Creating a System Diagram
The System Diagram provides a graphical representation of each Zone Definition system being modeled and displays summary price and transmission flows. A System Diagram has been created for all delivered example systems. A new diagram can be created by Aurora after the system is defined in the Zone Definition table by following the instructions below.
![]() NOTE: Editing an existing system or adding a new one to the Zone Definition table will require the creation of a new System Diagram.
NOTE: Editing an existing system or adding a new one to the Zone Definition table will require the creation of a new System Diagram.
Creating a System Diagram
- First, Create a new system in the Zone Definition table, or adjust one that is already there.
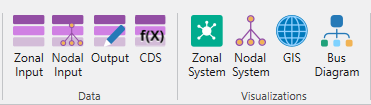
- Click the Zonal System button on the Aurora Home Ribbon.
3. Select File > New System Diagram option from the toolbar ribbon.
4. A new form will open that lists all available systems in the Zone Definition table that is currently selected In-Study. Select your new system from the list.
5. Note the new System Diagram table name is automatically populated to match the existing System name. This may be altered if desired.
6. Click OK.
7. The new System Diagram table is created (Energy Exemplar does not recommend directly editing the table). The table is automatically checked In-Study, and the System Diagram window is launched.
8. Note that system can now be formatted in any way the user would like. Larger nodes are important for output information that is included during or after a run inside the nodes. For example:
-
Select the zone #1 node in the diagram - All the objects are numbered according to the Zone ID in the Zone Definition system.
-
Click and drag area #1 node to the desired location on the screen. To adjust node sizing, click on a node and use the green dots to drag the area to the desired shape and size.
-
Arrange the other areas as desired (typically geographically) and select the Save to Input Databse button to save the layout.
-
Select the right-click RESIZE NODES options to apply the same shape and size of the selected node to the remaining nodes in the System Diagram.
Refer to the Tutorial called Creating Zone Definitions and System Diagrams for additional information.
Refer to the System Diagram window for more information on using the System Diagram.
![]() Creating a System Diagram
Creating a System Diagram