System Diagrams 
![]() NOTE: Viewing the System Diagram while Aurora is running will slow down run time significantly and is not recommended. Always use Pause or Step on the Aurora Home Tab in conjunction with this feature.
NOTE: Viewing the System Diagram while Aurora is running will slow down run time significantly and is not recommended. Always use Pause or Step on the Aurora Home Tab in conjunction with this feature.
This window provides a graphical representation of the system being modeled. The System Diagram is created by Aurora when you create a new system in the Zone Definition table and opens the System Diagram form by selecting the System button on the Home Tab Ribbon. Summary price and transmission flows are displayed on this screen.
The System Diagram will show various information depending on the active data Source applied.
![]() NOTE: Change Sets should not be used with the System Diagram table. A new System Diagram will need to be created when a new Zone Definition is created or an existing Zone Definition is modified. See the tutorial article: Creating Zone Definitions and System Diagrams.
NOTE: Change Sets should not be used with the System Diagram table. A new System Diagram will need to be created when a new Zone Definition is created or an existing Zone Definition is modified. See the tutorial article: Creating Zone Definitions and System Diagrams.
General Description
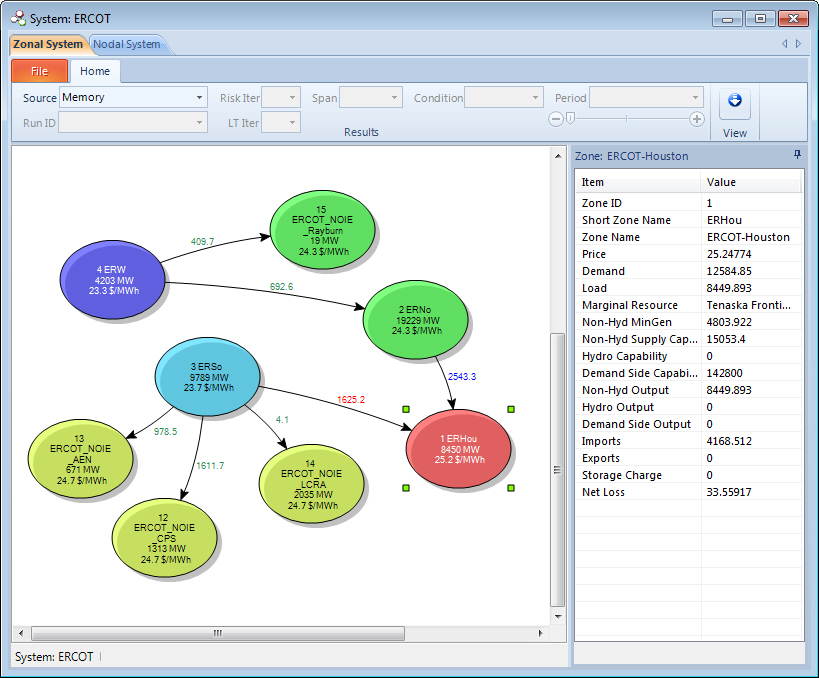
The diagram shows the following information depending on settings and reported output tables:
|
Zonal Information Source = Configuration Zone ID and Short Zone Name, or Pool Name
Input Link capacity between zones/pools. If a link capacity is referencing a vector (e.g., Time Series Monthly Table) instead of being entered as a static number the capacity will be shown as zero (0). Source = Memory or Output
Link Loading (color coded) Additional information is available in the detail bar when a zone/pool is selected. |
Nodal Information Source = Configuration LoadFlow Area Number and LoadFlow Area Name, or Aggregate Area Name
General tie flow connections. Input ratings are not available for viewing.
Source = Memory or Output
Additional information is available in the detail bar when a node is selected. |
File Ribbon
The File Menu with many useful features.
|
|
New System DiagramThis button creates a new system diagram after a new system is defined in the Zone Definition input table. Another box will pop up requesting you to select a system from a list of available options and to name the new table. For consistency, we recommend naming the system and the table the same thing. See Creating a System Diagram for more information. |
|
|
Save to Input DatabaseThis button saves changes in the diagram to the System Diagram table (the table is used to configure the diagram when it is first loaded). Editing the table directly is not recommended. |
|
|
Copy to ClipboardThis button copies an image of the diagram to the clipboard. The image can then be pasted into other documents or reports. |
|
|
This button prints an image of the system diagram as displayed on the screen. The image will be condensed to fit on one printed page. |


Results and Appearances Ribbon

Source: This setting determines the reference data for the diagram.
Options: Configuration (input), Memory (simulation must be running), and Output.
If the model is not running, the form will default to Configuration. When running, it will open with Memory selected.
![]() NOTE: For nodal diagrams, some output information is needed to build the diagram for the first time in Configuration mode. An informational warning may be written to the screen requesting the user to step or run the study.
NOTE: For nodal diagrams, some output information is needed to build the diagram for the first time in Configuration mode. An informational warning may be written to the screen requesting the user to step or run the study.
These settings are only available when Source = Output.
-
Run ID: This setting is used to select an available Run ID when Multiple Runs are written to the same database.
-
Case ID: This setting is only available on the nodal form and is used to select which Network Case information will be used in the diagram.
-
Risk or LT Iter: This setting is used to select the Risk or LT iteration from the output.
-
Span: Use this setting to select which output table is used for data display. Options in the dropdown will depend on valid output table types. For example, in the Zonal form options in the dropdown are dependant upon the Zone output, but Link information will only be shown if Link output is also present for that time period.
-
Condition: Use this setting to select which Condition is used for data display.
-
Period: Use this setting to select which Time_Period is used for data display. Optionally, use the slider beneath the Period setting to easily move through time in the diagram display.
The last section of the toolbar includes: View/Templates: The dropdown button opens a menu used for saving custom views of the system diagram.
![]() NOTE: These views are different from the typical Project Templates (.atz file) shown in the Explorer Bar.
NOTE: These views are different from the typical Project Templates (.atz file) shown in the Explorer Bar.
The options are:
Save/Save As: Saves the view in the project file.This is useful for arranging nodes and setting zone/pool or LFArea/Aggregate Area aggregation. Note that this option only saves the view to memory. The main project must be saved to permanently save the template.
Select Template: Depending on whether the Zonal or Nodal system is active, this option always offers Zones/Pools Only or Loadflow Area/Aggr Area Only. This offers a quick way to aggregate or disaggregate the entire system with one click. (Alternately, single nodes can be adjusted using the right-click menu discussed below.) Additionally, this dropdown will show any custom saved views.
-
Edit Template: The template grid can be used to copy or edit existing views/templates.
-
-
Direct editing of the SystemName field is not recommended unless being done to a copied row, which will facilitate extension of the template view to a new system.
-
If SystemDefault is selected (True) for a template, that view will be applied on system diagram load.
-
-
Background Map: Clicking the button opens a window to select and image to place behind the system diagram. This can be useful when you want a geographic representation of a report. The dropdown arrow expands to offer the option to Clear the image. Note that there are currently no options to alter the image size or opacity within Aurora. The image must be formatted before it is imported into the diagram window.
-
Color Scheme: Use this feature to change the color schemes of the system diagram nodes. The options are: Pastel, RGB (default), and RB. In general, colors will depict prices on a gradient scale with reds representing higher prices and blues representing lower prices. For example, if the RGB (Red/Green/Blue) color scheme is selected, the highest priced zones will be colored red and the lowest priced zones will be colored blue. Prices in between will be reflected by colors ranging between the two extremes.
Details Bar
The details bar shows additional information when a node or link/flow is selected. The information displayed will vary depending on which screen is active, zonal or nodal. The details bar offers quick access to additional information about a zone, pool, LFArea, or aggregate area and/or the flows between those regions.
Right-Click Menu
The right-click menu is only available when a node has been selected.
 |
|
![]() Run Management
Run Management
![]() System Diagram
System Diagram