PLEXOS User Interface Guide Chapter 11
Contents
1. Membership Viewer
This feature is available as a right-mouse command on any object in the Main Tree or Simulation Tree. The viewer allows you to follow the relationships between objects. In the illustration below we show the membership view for a Generator. The first panel shows all the memberships for the Generator (the 'root object'), the second shows the memberships for the selected child object in the first panel (for example all the memberships involving the Node that the Generator connects to). The third panel shows all the memberships for the selected object in the second panel. You can change the selections in any panel to show the corresponding memberships in the other panels. To change root object, just double-click any object in any of the panels. This allows you to keep following a trail of memberships through the database.
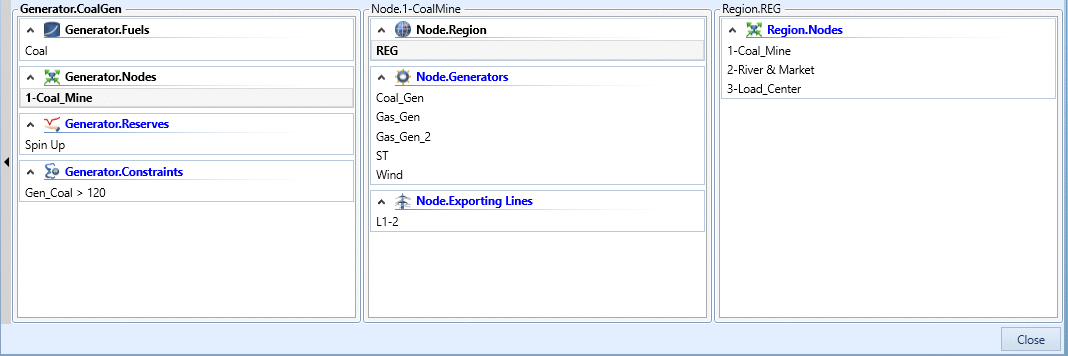
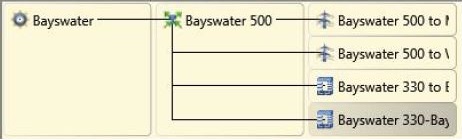
On the window ribbon tab, while the membership viewer is open, you will find the Membership Map command. Clicking this opens a window that draws a basic map of all the memberships as you navigate through them in the Membership Viewer.
2. Overview Window
The overview window presents the property tab information for a given model, as at a specified time.
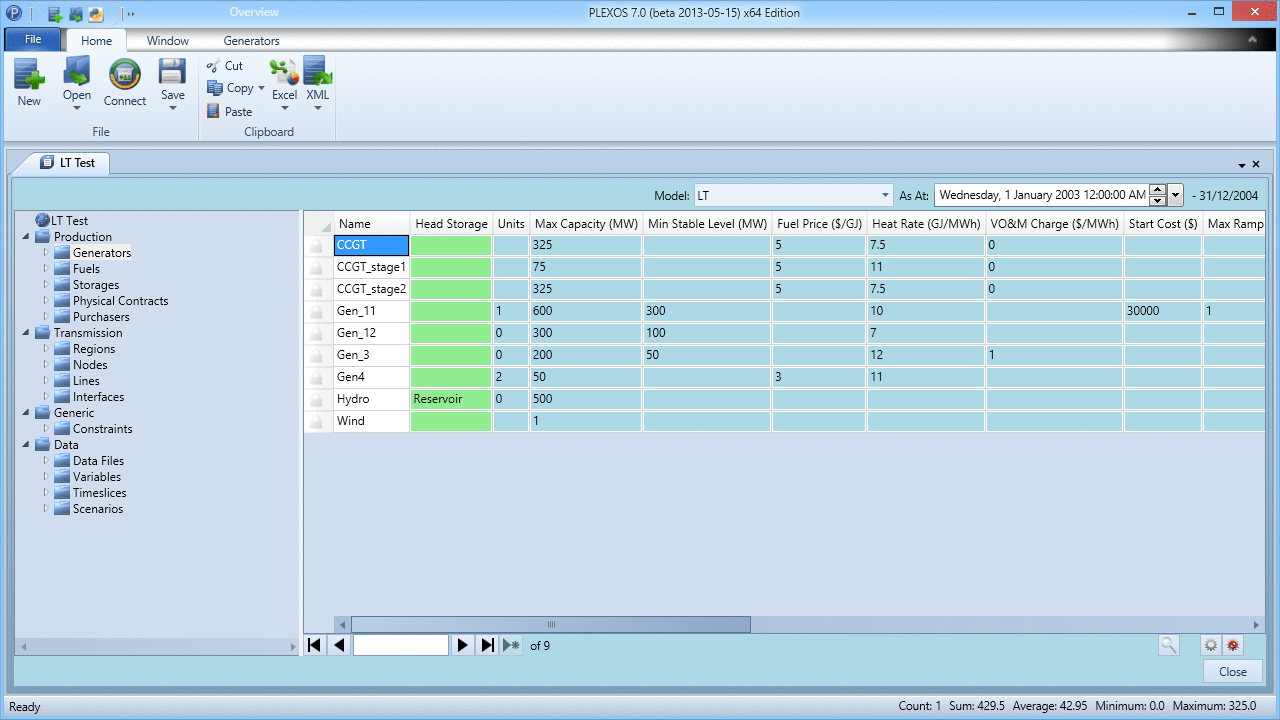 Overview Window
For the specified Model and Time given, the Overview Window will resolve the Templates, Scenarios, Date Ranges and Timeslices for each data row in order to present the value which will be used at that given time during the Horizon. As you modify the date field in the upper right corner, the values in the grid will update to show their value at that moment, taking into account the affects of date ranges, timeslices, scenarios, and template inheritance.
Note: Properties which are populated by a data file will only show the data file path.
3. Visualization Export
PLEXOS can export the transmission schema to one of a number of standard formats that can be viewed in visualization tools. The schema can be saved with or without coordinates. If you wish to enter the exact coordinates you can enter them on the attributes:
- Node [Latitude] and Node [Longitude]
- Generator [Latitude] and Generator [Longitude]
- Storage [Latitude] and Storage [Longitude]
To export the power system including nodes, lines, transformers and connected generators, storages and waterways, select the Visualization command from the Backstage menu. The menu allows you to write to one of these formats:
- Google Earth (KML): can be opened directly in Google Earth.
- Geographical Mark-up Language (GML): can be read by many third-party tools, such as Cytoscape.
For more detail see the "Visualization" section of the PLEXOS help file.
4. Map Visualization
Map visualization window is accessed using the Map button from the Map tab of ribbon-style menu.
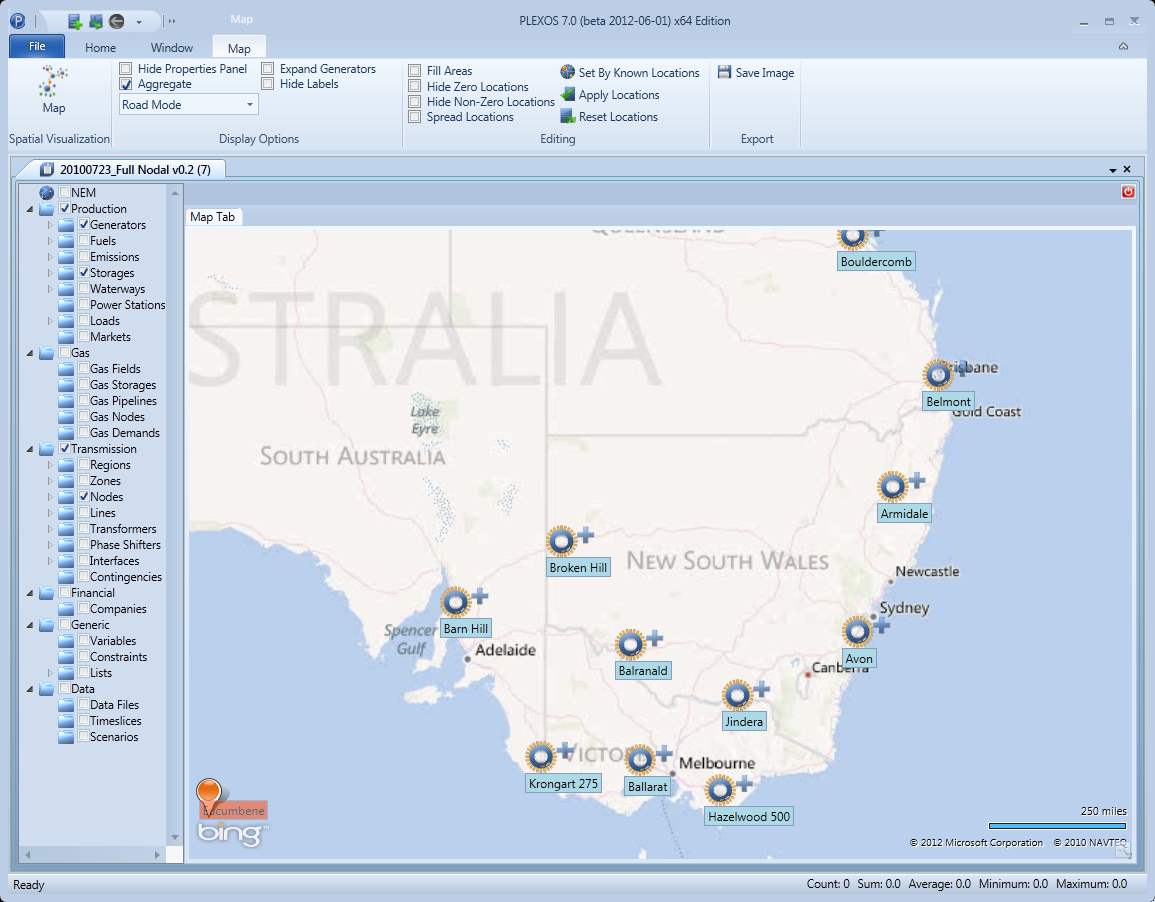
Please refer to the documentation for Map Visualization for details on how to use Bing Map visualization function of PLEXOS GUI.
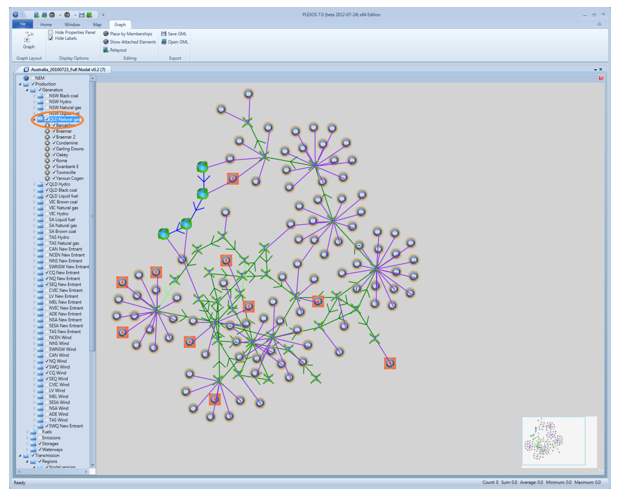
5. Graph Layout
Graph layout uses graph style visualization functions of PLEXOS GUI for input databases. Graph window is accessed using the Graph button from the Graph tab of ribbon-style menu.
Please refer to Graph Layout for details on how to use graph style visualization functions of PLEXOS GUI.