Productivity Enhancements
Aurora, as a productivity enhancer, leads the energy industry with its unique productivity tools.
Scripting Enhancements
The Scripting makes writing and debugging scripts much more friendly. Aurora's scripting interface uses Visual Basic (VB) to automate many utilities.
Click the scripting button to display the Aurora scripting interface, where you can create, edit, save, open, and run script files or script projects. By default, the Scripting window opens a VB file.
You can now write scripts in VB, Visual Studio, and Iron Python. While none of the Aurora‐specific commands have changed, the new Scripting window offers powerful features. A new summary area at the bottom of the screen offers options like showing lists of breakpoints, compiler errors, output statements, call stacks, and local variables, as well as watch lists and find results. In addition, you can now group script files into script projects to build sophisticated automation tools in Aurora.
Gurobi Tuner
The new Gurobi Tuner is a tool Energy Exemplar has developed to assist new and existing Aurora clients in using Gurobi as their solver. The tuner reads problem data from Aurora simulations written by the Gurobi solver. The tuner works to improve runtime by solving these problem files with many different sets of solver parameters to find what works best for the study. The tuner outputs the best parameters found in a file. This file can then be used in Aurora to run future studies with potentially improved runtimes.
Computational Datasets (CDS)
Access and modify detailed variables during every hour of the simulation using Computational Datasets to modify data dynamically based on specified conditions.
Portfolio Analysis and Optimization
Perform pricing forecasting, Portfolio Analysis and uncertainty analysis with a single tool over virtually any time period.
The capability to perform Portfolio Optimization using a risk-reward framework and a linear optimization model.
The goal of the optimization is to calculate a user-specified number of optimal portfolios – those with the highest reward and lowest risk – given the constraints of the portfolio and its acquirable resources. Each portfolio found by the simulation will lie along the Efficient Frontier, which means that no other portfolio with a higher reward at the same risk level exists, and no other portfolio with a lower risk at the same reward level exists. The added rigor of this approach will contribute to more credible, defensible results for regulators and senior management.
Memory Tables
View results in Memory due to the absolute modeling transparency. Memory tables display only the current hour results. The selected table opens in a new window, with some editing features. See Editing Database Tables or the Input Table Right-Click Menu for more information.
Custom Memory Tables can be created for use with Computational Datasets to achieve significantly faster run times. See Custom Memory Tables for more information.
Output Reporting Options
Control Output Results by time periods and conditions; either for the entire analysis or for selected areas, resources, resource groups, or fuels.
These capabilities enable greater productivity in setting up, processing, and producing results for decision makers.
Data Productivity
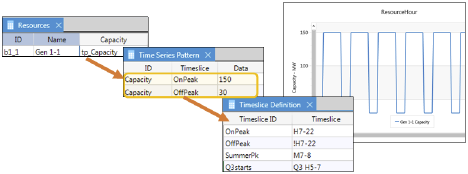
Aurora has two new options for defining time series data, providing significant flexibility when entering sparse data that follows an hourly, daily, weekly, monthly, or even quarterly pattern. There is no longer a need to duplicate data, but just enter the values and specify exactly which time periods they apply to in a powerful format with available expressions for just about any scenario.
Timeslice Definition
The Timeslice Definition table is used to define a reusable "timeslice" which is shorthand that uses characters and ranges to define time, as opposed to many cells in a typical Time Series table. Once the timeslice is defined it can be referenced from the Time Series Pattern table (below). So instead of having to define 168 hours in a weekly shape, you can now define time with a simplified shorthand.
Time Series Patterns
The new Time Series Pattern table defines custom time patterns for data using key characters (timeslice) or a reference to a defined timeslice. You can have multiple Pattern tables, just like the Time Series Hourly, but be sure to keep unique IDs in each table.
We have extended the Time Series Pattern table with a new Holiday input that can be used in place of the date columns. For the US holidays, the date used will be the observed date and is calculated for each year of the study.
![]() Aurora Features
Aurora Features
![]() Productivity Enhancement
Productivity Enhancement