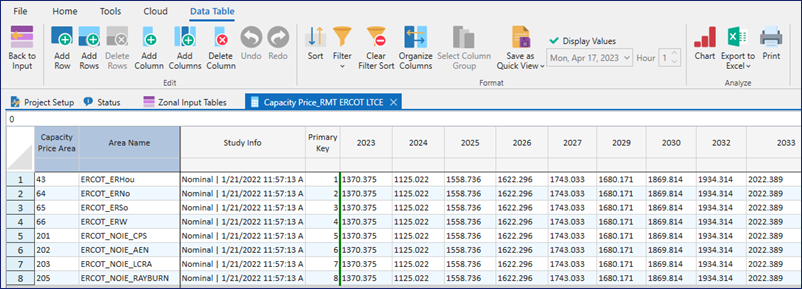
Capacity Price Table
The Capacity Price table stores annual capacity prices in $/MW-week by area (note this is regardless of any unit conversion, i.e. it is always written in USD). The table is typically the result of a long-term study with Use reserve margin capacity targets enabled (Simulation Options > Long Term), moving the results from the Time Series Annual table and the Resource Modifier Table (RMT) into one easy-to-decipher location.
![]() NOTE: When opened, this table shows a filtered view based on the areas, zones, or pools running in the study system. The User Default Quick View overrides Automatic Filters, or you can turn them off using the Project Options in the Options window.
NOTE: When opened, this table shows a filtered view based on the areas, zones, or pools running in the study system. The User Default Quick View overrides Automatic Filters, or you can turn them off using the Project Options in the Options window.
The table is named by adding “Capacity_Price_” as a prefix to the RMT name. This indicates to the user that this set of capacity prices was calculated from the same long-term study run that generated the RMT of the same name.
![]() NOTE: Both the Capacity Price and RMTs are written back to the input database so they can be used in subsequent runs, with one exception. They cannot be included “in study” for subsequent long-term runs unless the Use Capacity Price table as input option is selected. In regular (non-long-term runs, including a Capacity Price table “in study” will not affect the dispatch or calculation of energy prices, but will be used to calculate a capacity revenue stream for each resource that resides in an area with non-zero capacity prices. As such, Energy Revenue, Capacity Revenue, and Revenue (sum of energy revenue, capacity revenue, spin reserve revenue, and non spin reserve revenue) are reported separately. See Resource Output for more information.
NOTE: Both the Capacity Price and RMTs are written back to the input database so they can be used in subsequent runs, with one exception. They cannot be included “in study” for subsequent long-term runs unless the Use Capacity Price table as input option is selected. In regular (non-long-term runs, including a Capacity Price table “in study” will not affect the dispatch or calculation of energy prices, but will be used to calculate a capacity revenue stream for each resource that resides in an area with non-zero capacity prices. As such, Energy Revenue, Capacity Revenue, and Revenue (sum of energy revenue, capacity revenue, spin reserve revenue, and non spin reserve revenue) are reported separately. See Resource Output for more information.
As an input table, the values in the Capacity Price table can be modified, saved in Change Sets, etc. just like other input tables. However, only annual differentiation is allowed. If the area capacity prices are modified so there is intra-zone differentiation, then Aurora will calculate a capacity-MW-weighted average for the zone. Zone capacity credit is reported in nominal $/MW-week. See Zone Output for more information.
See Long-Term Optimization Logic for more information on long-term studies.
|
COLUMNS INCLUDE |
|||
![]() Capacity Price Table
Capacity Price Table