Risk Table
The Risk Table enables you to apply uncertainty to a selection of input variables when performing a Risk Simulation, or risk analysis study. Use this table to specify which input variables to vary as well as the distribution samplings that define the possible variation. Variability can occur at an annual, monthly, or daily time step level. Correlation between variables can also be easily specified.
Risk variables cover a large degree of the uncertainty present in the fundamental drivers for the cost and reliability of power systems, including fuel prices, demand levels, unit forced outage, transmission availability, and levels of hydropower generation.
Variation can be specified at an aggregated or disaggregated level for each variable class.
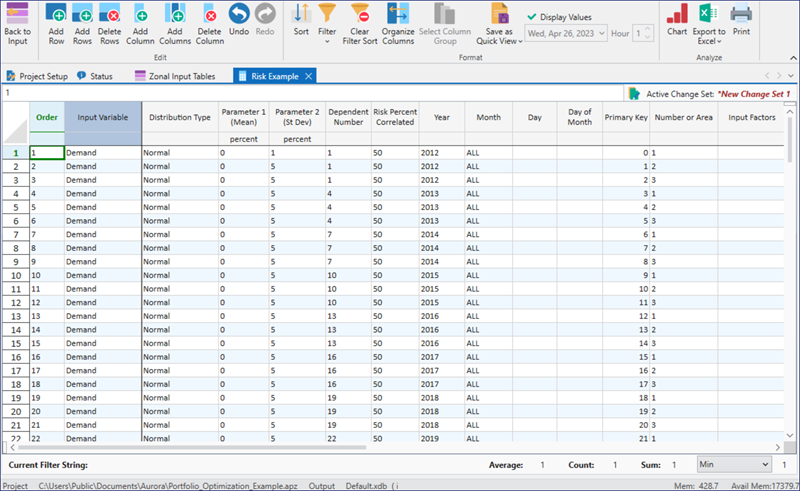
A Risk Input table must be selected in Aurora to use it in a risk study. When building this table, keep in mind that the Order column plays an important role. Each record in the input table uses variable IDs and date information to specify that a single variable or group of related variables uses a defined sampling distribution for a defined time period.
Records are processed in ascending order of the values specified in the Order column, and any ID set or time period that overlays any portion of a lower ordered input record for that same set will supersede it for that portion.
Consider this ascending order when building the table. Use the most general definition of variable IDs, time periods, and sampling distributions earliest in the input order. Then, add subsequent records to the table with increasing granularity to fine-tune the uncertainty for selected inputs in the study.
Note that a single record will only be sampled exactly once in each risk iteration. Results from the sampling distributions are returned in percentage adjustment terms, and that percentage adjustment is applied to a base value determined by the standard data inputs for each variable in the set. For example, a single risk record might be defined for demand for all zones in 2005. If the sample yielded an adjustment of plus 7% in a given iteration, the demands for all zones would be adjusted upward by 7% across all of 2005. In this case, a separate sample would not be taken for each zone.
The risk simulation results of the sampling for each record, by risk iteration, are automatically stored in the Risk Output table.
Generic Risk Variables can be applied via the gr_ reference in the data cell to be shocked, or via CDS references. For more information on applying Generic Risk Variables see MORE on Generalized Risk.
|
COLUMNS INCLUDE |
|||
 Risk Table